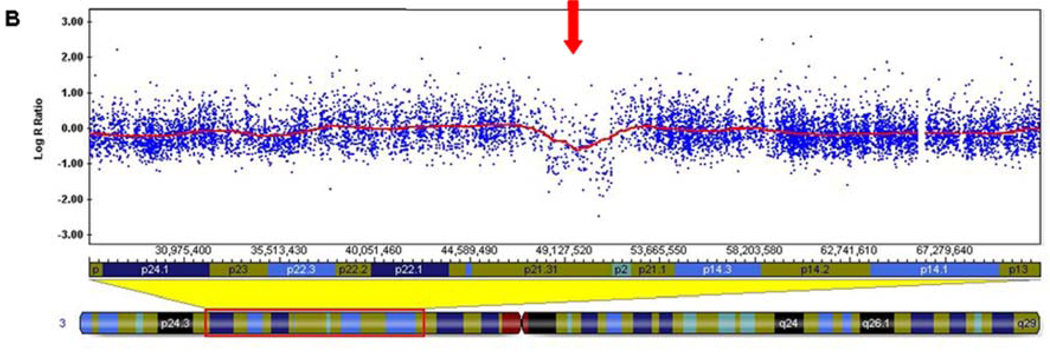
Figure 1. Illumina 550k Human HapMap microarray results.
A) Log R ratio of all SNP probes on chromosome 3, with the 3.1 Mb deletion noted by a decrease in the Log R ratio (red arrow). Each blue dot represents a single SNP-based probe and the red line is a smoothing curve over a 200 Kb genomic window. The Log R ratio for diploid probes are distributed around 0.0. The Log R ratio for hemizygously deleted probes are distributed around −0.5. B) Higher magnification view of the 3p21.31 deletion (red arrow).


