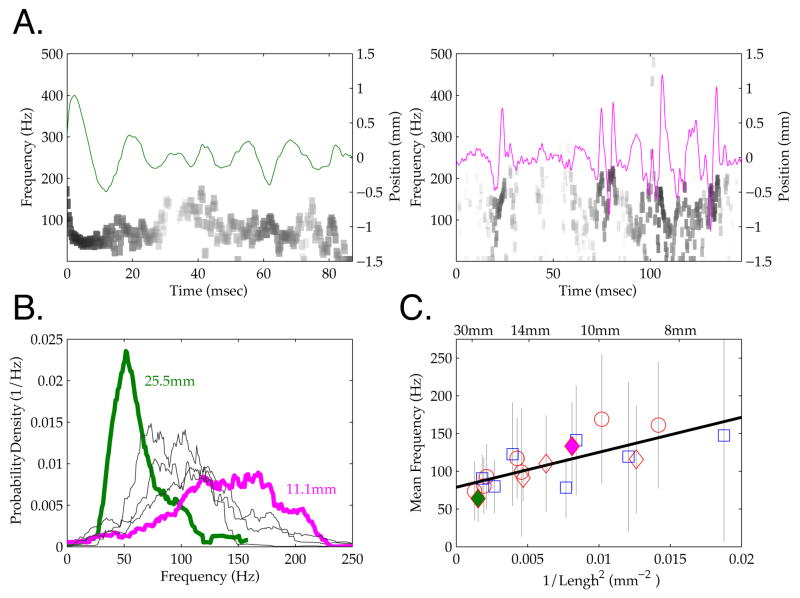
Figure 4. Vibrissa Frequency Gradient During Rough Surface Contact.
A. Micro-motion timeseries are shown for two vibrissae during simultaneous contact with a rough surface (green and magenta lines, axis on right). Grayscale shows the instantaneous power (log scale) measured across frequency and time by a Hilbert transform (axis on left: see Methods). Distinct differences in frequency can be observed for the two vibrissae, reflecting the frequency difference evident in the motion trace. Note differences in time scale (x axis). B. The distribution of micro-motion frequencies for 5 vibrissae that contacted a rough surface during the same trial. The distribution from the line scan in the left hand panel of 4A is shown in green, and that from the right hand shown in magenta; annotation provide the lengths of these vibrissa. C. The mean frequency (symbols) and standard deviations (grey bars) for all scanned vibrissae (N = 19) during rough surface contact is plotted against 1/Length2. Red and blue color indicate data from two rats, common symbols indicate samples from distinct vibrissae on the same trial. As described in the text, a significant linear relationship was observed between length and frequency (black line), as predicted by the mechanical properties of the vibrissae. Note that this relation held not only for the population measured across multiple trials, but also for simultaneous contact of multiple vibrissae within each trial.

