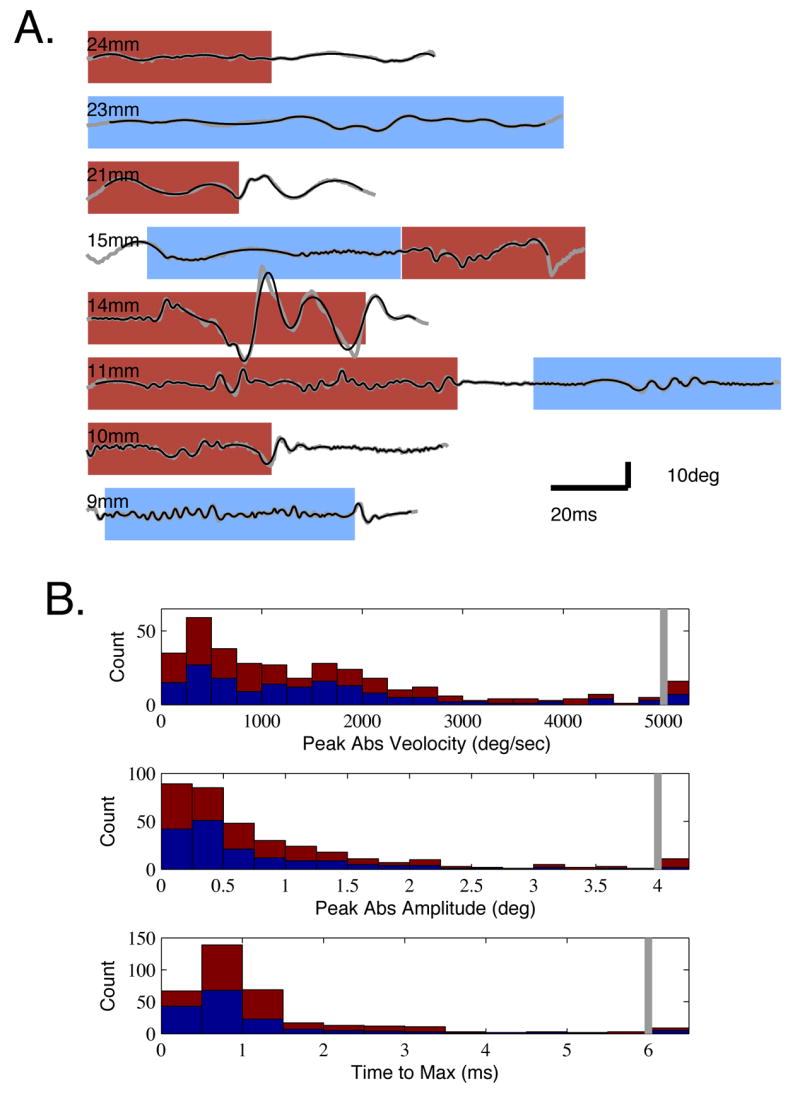
Figure 7. Examples of Micro-Motion Patterns and Marginal Distributions of Event Parameters During Contact with Rough and Smooth Surfaces.

A. Example timeseries (gray) of angular position measured 5mm from the base in head centered coordinates. Traces are ordered from long to short vibrissa (top to bottom), with lengths indicated by the legends. The 2nd order fits used to define event parameters are overlaid (black). Times of rough (red) and smooth (blue) surface contact are indicated by shaded backgrounds. B. Histograms of three micro-motion parameters: peak velocity, amplitude and rise time. Red indicates events occurring during rough surface contact, and blue indicates smooth surface contact, stacked together. All observations in the bin to the right of the gray bars are totals for events greater than that value (e.g., greater than 5000°/sec velocity in the top plot).
