Figure 2.

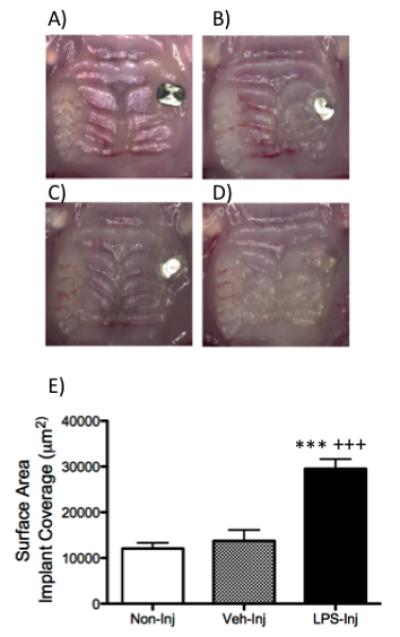
A) Representative clinical image of the mouse maxilla at four weeks after implant placement. B) Representative clinical images of a mouse maxilla in the B) non-injected, C) vehicle-injected and D) LPS-injected groups at six weeks after initiation of implant treatment. E) Graph represents surface area exposed by soft tissue of the non-injected, vehicle-injected and LPS-injected groups six weeks after injections were initiated. Data are mean ± SEM. ***p<.0001 compared to control and +++p<.0001 compared to vehicle (n≥5/group).
