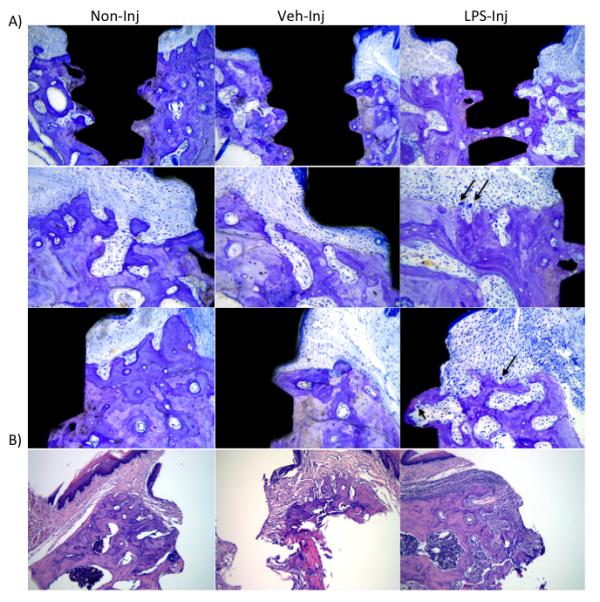
Figure 4.

A) Representative images of toluidine blue stained sections six weeks after treatment (non-injected, vehicle-injected and LPS-injected groups); 100X magnification. Notice different bone levels between the experimental and the control/vehicle groups. Black arrows represent osteoclasts. B) Representative images of hematoxylin and eosin stained sections six weeks after treatment weeks after treatment (control, vehicle and experimental groups), 100X magnification. Notice the presence of a dense mixed inflammatory cell infiltrate in the experimental group as compared to the control/vehicle groups.
