


Table 2. Comparison of Pediatric Patient and Adult Patient Demographic Data.
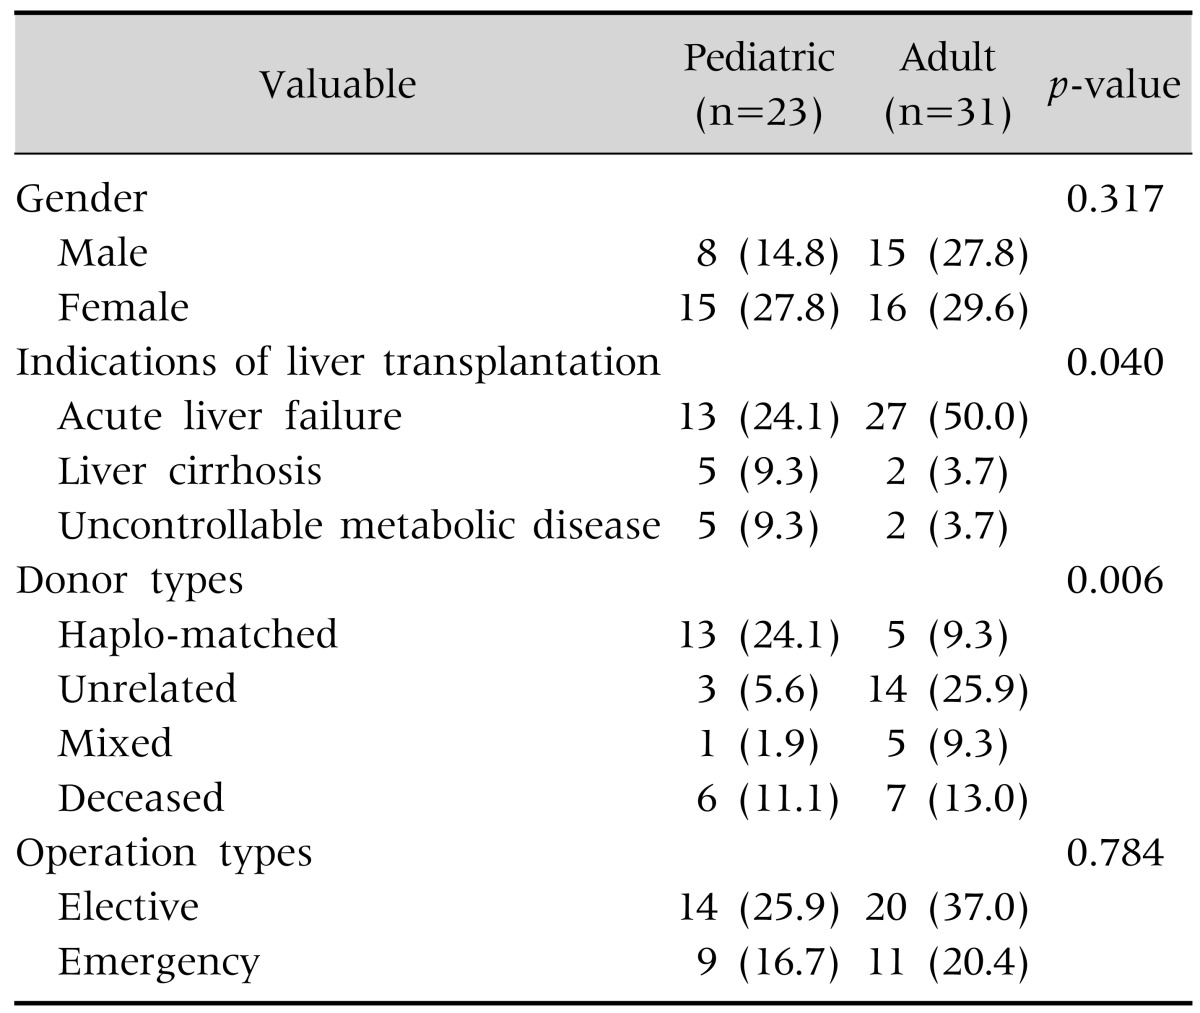
Values are presented as the number (%).
Official websites use .gov
A
.gov website belongs to an official
government organization in the United States.
Secure .gov websites use HTTPS
A lock (
) or https:// means you've safely
connected to the .gov website. Share sensitive
information only on official, secure websites.
Values are presented as the number (%).