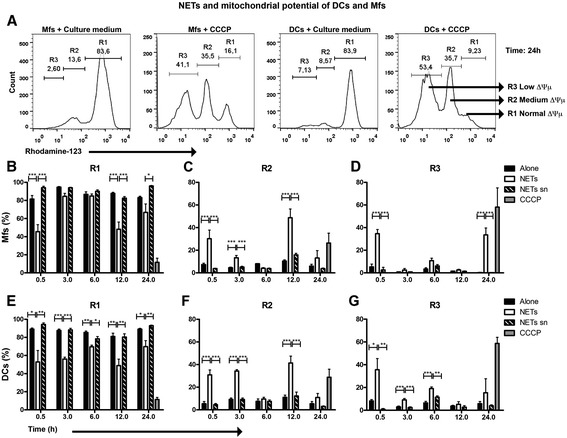
Figure 3.

Analysis of mitochondrial membrane integrity from Mfs and DCs exposed to NETs or NETs supernatants. Percentage of macrophages (B-D) or dendritic cells (E-G) incubated with NETs and found in different regions of histograms upon staining with Rhodamine-123. Rhodamine-123 labeling was evaluated at 0.5, 3, 6, 12 and 24h post-incubation with NETs. The histograms shown in (A) are examples only to illustrate the regions obtained from two experimental conditions, in this example from Mfs and DCs cultured for 24 hs with medium alone or CCCP (positive control), where R1: normal ∆Ψμ, R2: medium ∆Ψμ, R3: low ∆Ψμ ∆Ψμ: mitochondrial membrane potential, Mfs: Macrophages, DC: Dendritic cells, NETs sn: NETs supernatants, CCCP: Carbonyl cyanide m-chlorophenyl hydrazone. *P = 0.01; **P = 0.001; ***P < 0.0001, one-way ANOVA.
