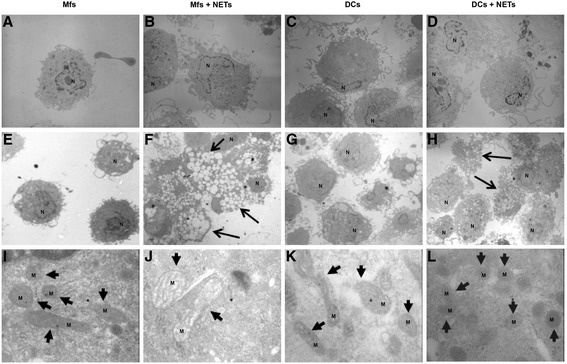
Figure 5.

Ultrastructural analysis by transmission electron microscopy of macrophages and dendritic cells incubated with NETs. Macrophages (A,B,E,F,I,J) and dendritic cells (C,D,G,H,K,L) stimulated with NETs (B,D,F,H,J,L) or without stimulation (A,C,E,G,I,K) at 30 minutes (A-D) and 24 h (E-L). Small arrows indicate mitochondria, large arrows indicate vacuolated cells. 3150X (A-H) and 50,000X (I-L). M: Mitochondria, N: Nuclei, Mfs: Macrophages, DC: Dendritic cells.
