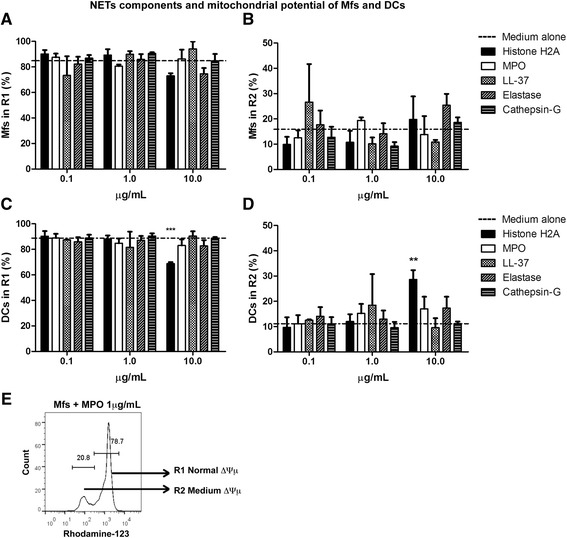
Figure 7.

Analysis of mitochondrial membrane integrity from macrophages and dendritic cells exposed to individual NETs components. Percentage of macrophages (A,B) or dendritic cells (C,D) incubated with Histone H2A, MPO, LL-37, Elastase, Cathepsin G and subsequently stained with rhodamine-123. Rhodamine-123 labeling was evaluated at 24 h post-incubation with NETs components. Histogram in (E) is one example depicting the regions obtained from one experimental condition, in this case Mfs cultured with medium alone for 24 h, where R1: normal ∆Ψμ, R2: medium ∆Ψμ. ∆Ψμ: mitochondrial membrane potential, Mfs: Macrophages, DC: Dendritic cells, MPO: Myeloperoxidase, LL-37: Cathelicidin LL-37. **P = 0.001; ***P < 0.0001, one-way ANOVA.
