
Figure 11.
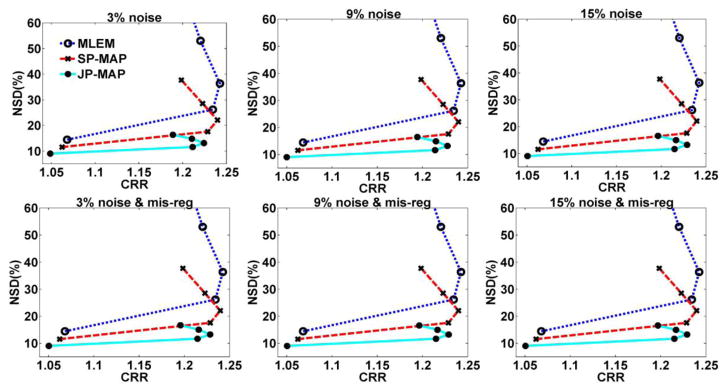
Plots of gray matter NSD (noise) versus lesions overall contrast for reconstructed images (from top to bottom) changing with the iteration number (increasing iterations of 1, 2, 3, 5 and 10 (16 subsets)), using: (i) conventional MLEM reconstruction (MLEM), (ii) conventional MAP reconstruction (SP-MAP), and (iii) proposed MAP reconstruction (JP-MAP).