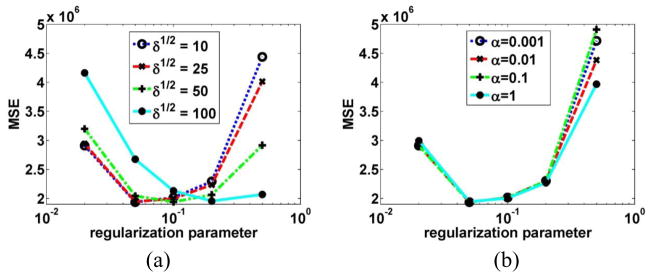
Figure 5.

(a) Plots of MSE as a function of the regularization parameter for SP-MAP reconstructed images at 10 iterations (16 subsets) for different δ values. (b) Plots of MSE as a function of the regularization parameter for SP-MAP reconstructed images at 10 iterations (16 subsets) for different α values.
