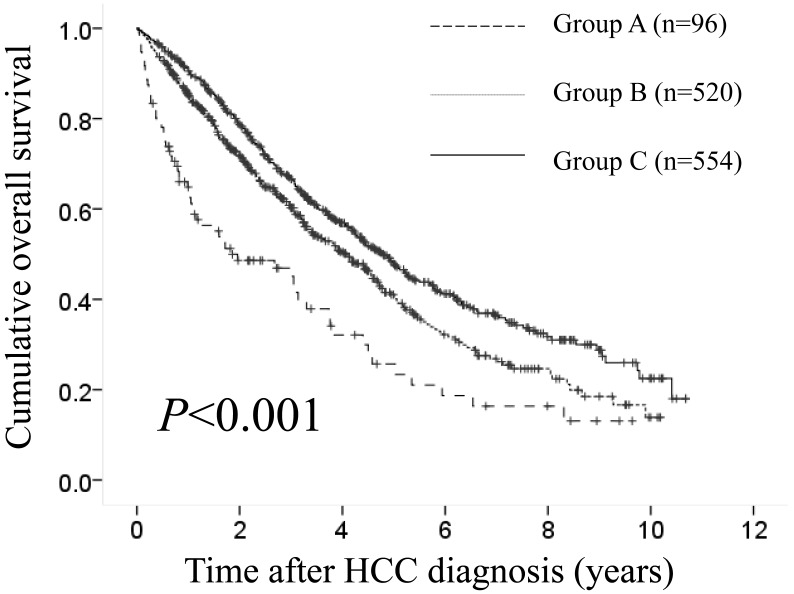
Fig 3.
Cumulative overall survival (OS) rates in group A (serum sodium ≤135 mmol/L, n=96), group B (135 mmol/L < serum sodium ≤140 mmol/L, n=520) and group C (serum sodium >140 mmol/L, n=554). The 1-, 3- and 5-year cumulative OS rates in groups A, B and C were 64.8%, 46.9% and 25.7%, respectively, in group A, 85.5%, 60.5% and 41.1%, respectively, in group B and 90.7%, 66.6% and 48.2%, respectively, in group C (P<0.001).

