Abstract.
Assessing nerve integrity and myelination after injury is necessary to provide insight for treatment strategies aimed at restoring neuromuscular function. Currently, this is largely done with electrical analysis, which lacks direct quantitative information. In vivo optical imaging with sufficient imaging depth and resolution could be used to assess the nerve microarchitecture. In this study, we examine the use of polarization sensitive-optical coherence tomography (PS-OCT) to quantitatively assess the sciatic nerve microenvironment through measurements of birefringence after applying a nerve crush injury in a rat model. Initial loss of function and subsequent recovery were demonstrated by calculating the sciatic function index (SFI). We found that the PS-OCT phase retardation slope, which is proportional to birefringence, increased monotonically with the SFI. Additionally, histomorphometric analysis of the myelin thickness and -ratio shows that the PS-OCT slope is a good indicator of myelin health and recovery after injury. These results demonstrate that PS-OCT is capable of providing nondestructive and quantitative assessment of nerve health after injury and shows promise for continued use both clinically and experimentally in neuroscience.
Keywords: polarization sensitive-optical coherence tomography, myelin, sciatic function index
1. Introduction
Normal function of the peripheral nervous system relies not only on nerve continuity from the central nervous system to the target organ(s), but also on the integrity of the myelin surrounding nerve fibers. Experimentally, nerves need to be excised for histological evaluation of nerve fiber counts and degree of myelination to determine nerve viability. Since histological assessment cannot be performed clinically without destroying the nerve, current nondestructive nerve assessment is largely based on electrical studies and clinical observation of the nerve. Although electrical evaluation has been shown to reflect nerve health, the results do not offer direct quantitative information regarding nerve function, structure, or the degree of myelination. A clinically useful, nondestructive method to quantitatively evaluate nerve function and structure could provide valuable information regarding the extent of nerve injury and help shape treatment strategies for restoring neuromuscular function.
The concept of peripheral nerve imaging has been examined previously in both experimental and clinical settings. These studies have relied largely on ultrasound1,2 and more recently using both T2 weighted and gadolinium-enhanced MRI.3–9 These techniques, while valuable modalities, are unable to accurately assess the microenvironment of the peripheral nerve in a manner by which structural damage and myelination can be quantified. With the advent and more recent refinement of in vivo optical imaging techniques, a more thorough examination of the microarchitecture of the peripheral nerve may be achieved. Previously studied modalities include confocal microscopy,10,11 two-photon microscopy,12 coherent anti-Stokes Raman scattering microscopy,13,14 and time-domain optical coherence tomography (OCT).15–17 To date, none of these imaging techniques have been successful in reliably quantifying the nerve function or degree of axonal myelination because of limited imaging depth and resolution contrast.
OCT18 has found great utility for in vivo studies in a number of clinical fields. OCT is an optical imaging technique that provides cross-sectional images with the same scale and geometry as histology. Traditional, or time-domain, OCT detects the time delay of light backreflected from within a sample in a manner analogous to the detection of the time delays experienced by sound waves in ultrasound. However, the much higher propagation speed of light compared with sound necessitates interferometric detection of time delays in the former case; a reference arm length is scanned in order to detect the extremely short temporal delays for light backreflected from different depths within a sample. Detection of the amplitude of the light reflected in this manner has been previously used to identify nerve in tissue such as the prostate gland,19,20 but was unable to assess the nerve microenvironment in a quantitative manner.
The recent advent of Fourier-domain OCT, in both rapid tunable source and spectrometer-based varieties, has vastly improved the clinical utility of the technique. In the spectrometer-based technique, otherwise known as spectral-domain OCT (SD-OCT),21–23 the interference pattern for light returning from the sample and a fixed reference arm is spatially dispersed using a custom-built high-resolution spectrometer. Mathematical transformation of the resulting signal allows for simultaneous determination of all points in a particular depth profile. Fixing the reference arm length improves the phase stability of the system, and spectral detection of the interferogram has been shown to allow for much greater acquisition sensitivity at a particular optical power.24–28 This sensitivity improvement can be translated into an order of magnitude increase in imaging speed. Thus, SD-OCT provides for detailed scanning of a large volume of tissue, removing the sampling error associated with acquisition of particular two-dimensional images in time-domain OCT.
Functional extensions of OCT can yield information not readily visible otherwise, much in the same way various stains can enhance histological processing. Polarization-sensitive OCT (PS-OCT) uses not only the amplitude, but also changes in the polarization state of light returning from within a sample, allowing for access to light polarization changing properties such as birefringence.29–31 Birefringence is a material property where the refractive index depends on the polarization state of light. Birefringence introduces a change in the polarization state of light which can be quantified by the phase retardation. A number of biological samples exhibit birefringence, the amount of which can be attributed to a combination of the density and organization of fibrous structures. Myelin is one such structure that exhibits birefringence and to a much greater extent than any other component of the peripheral nerve. Therefore, the degree of myelination of the peripheral nerve can be quantifiably assessed through determination of its birefringence, and any subsequent change in this microenvironment following injury will be reflected in a change of birefringence. Similar technology has been previously used with success for the assessment of birefringence changes in skin following thermal damage due to denaturation of dermal collagen32 as well as for determining the structural features in rat sciatic nerve.33 In this animal study, we evaluate the ability of PS-OCT to assess the microenvironment of the normal and injured peripheral nerves following nerve crush injury and nerve transection.
2. Materials and Methods
2.1. Animal Model
The Massachusetts General Hospital Institutional Subcommittee on Research Animal Care (SRAC) approved all procedures described. We used the sciatic nerve of the Sprague Dawley rat (Charles River Laboratories, Wilmington, Massachusetts) as a model for this study. This robust model allowed for manipulation of a nerve of similar caliber and size to the human digital nerve and forms the basis of an objective assessment of motor function following injury.
2.1.1. Nerve crush injury (groups 1 to 4)
Animals were randomized into four groups () and anesthesia was achieved with an intraperitoneal injection of pentobarbital sodium (, Abbott Laboratories, Chicago, Illinois). This was followed by surgical exposure of the right sciatic nerve via a dorsolateral muscle splitting incision. A standardized demyelinating crush injury34 was reproduced by a single surgeon in the right sciatic nerve of the animals. The crush injury was produced by holding a #5 jewelers forceps closed across the nerve for 30 s, 1-cm distal to the exit of the nerve from the pelvis. The site was then marked with a single 10.0 nonabsorbable nylon suture (Ethicon, Somerville, New Jersey) placed under microscopic guidance. Surgical wound closure was performed using 4-0 absorbable polyglactin sutures (Ethicon). Functional analysis of walking track data (described below) was undertaken at weeks 1, 2, 3, and 4 following injury. Surgical exposure followed by PS-OCT imaging was undertaken at the same time points, after which the animals were euthanized and the imaged regions were harvested for histological processing. The uninjured nerve from the contralateral limb was used as a control and was imaged concurrently with the experimental nerve.
2.1.2. Nerve transection (group 5)
An additional control group () underwent nerve exposure as defined above. This was followed by sharp transection of the right sciatic nerve at a point 1-cm distal to the exit of the nerve from the pelvis. The distal stump of the nerve was buried in the surrounding muscle to prevent neural regeneration. Surgical closure followed the procedure as described above. These animals underwent PS-OCT imaging 2 weeks following their surgical procedure.
Throughout the study period, animals were housed in the Massachusetts General Hospital animal facility with unlimited access to water and rat chow. They were permitted to mobilize without restraints. Buprenorphine 0.1 to SC every 8 to 12 h was administered for 3 days following each surgical procedure to alleviate any pain and discomfort.
2.2. Walking Track Analysis
Walking track analysis was performed following injury in order to calculate a sciatic function index (SFI) as described by Bain and Mackinnon.35 This functional analysis was undertaken to confirm recovery over time following sciatic nerve crush injury. To achieve this, the animal’s hind paws were dipped in a dilute India ink solution before the alert animal was placed into a corridor and allowed to walk into a darkened box. Removable paper lining the corridor recorded each individual print. Three separate measurements of print length, toe-spread (distance between first and fifth toes), and intermediary toe-spread (distance between second and fourth toes) were taken from both left and right paws, with the nonoperative left paw print used as a control. The SFI was calculated using the equation as described by Bain and Mackinnon, with a value of zero representing normal function and more negative values up to representing sciatic or functional impairment.
Using this standardized assessment of function in a longitudinal manner allowed for confirmation of the initial injury and regeneration over time following sciatic nerve crush. Each animal underwent weekly analysis up to imaging with PS-OCT and sacrifice.
2.3. Histology and Histomorphometry
2.3.1. Histological preparation
Following PS-OCT imaging, animals were sacrificed with an intraperitoneal injection of pentobarbital (). Both experimental and uninjured sciatic nerves were harvested and fixed in a 2% glutaraldehyde/2% paraformaldehyde solution at 4°C for 48 h. Specimens underwent postfixation in 1% osmium tetroxide. This was followed by dehydration in ethanol and embedding in epon. Cross sections () were made at the site of the nerve crush injury using a microtome (Leica Biosystems, Germany). The colateral control nerve (uninjured and group 5) underwent sectioning at a point 1-cm distal to the exit of the nerve from the pelvis and at the transection site of the nerve, respectively. All samples were stained with 0.5% (w/v) toluidine blue in preparation for light microscopy.
2.3.2. Histomorphometric analysis
Nerve architecture was examined at magnification. Five images were taken of the evenly distributed areas of each segment within each nerve sample. Ten fibers were randomly selected in each image (a total of 50 fibers per nerve sample). The fiber width and axon diameter were measured using Image J Software.36 Myelin thickness was derived from the difference between the fiber and axon diameters. In addition, the -ratio of each fiber was calculated as a ratio of the axon diameter to the fiber diameter.
2.4. Polarization-Sensitive Optical Coherence Tomography
To achieve real-time imaging of the injured and normal sciatic nerves, a high-speed multifunctional SD-OCT system was used.37 This system uses a broadband light source centered at and two InGaAs line scan cameras, with acquisition of individual axial scans (in ) at a rate of 18,500 per second (Fig. 1). The multifunctional properties of the system used allowed for simultaneous visualization of intensity and PS-OCT imaging by passing the light from both arms through a fiber splitter and circulator and then directing it toward a polarization-sensitive spectrometer. In the spectrometer, the light was split with a polarizing beam splitter cube and projected onto two 512-element InGaAs line scan cameras (Sensors Inc., SU 512LX). Data were acquired and visualized in real time using a custom multithreaded software scheme running on a dual processor computer. Separate displays allowed for continuous real-time updates of spectrum, intensity, and polarization properties of the sample.
Fig. 1.
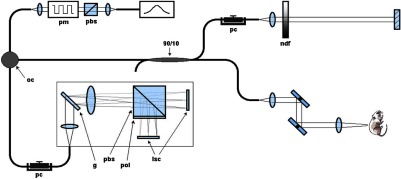
Schematic of polarization sensitive-optical coherence tomography (PS-OCT) system (pbs: polarizing beam splitter, pm: polarization modulator, oc: optical circulator, ndf: neutral density filter, pc: polarization controller, g: grating, pbs: polarizing beam splitter, pol: polarizer, and lsc: line scan camera).
All nerves were imaged identically. The fast scanning axis of the sample beam was oriented perpendicular to the length of the nerve to produce cross-sectional images composed of 2048 depth profiles spanning 5 mm. The imaging depth was 1.2 mm. A sequence of 200 such images was acquired over a 5 mm length for each imaged sample. Complete mathematical analysis of each dataset was performed.32,33,38 In summary, birefringent tissue regions were detected in PS-OCT by depth-dependent changes in the cumulative phase retardation experienced by different polarization states of the reflected light. With an increase in tissue birefringence, more rapid changes in both phase retardation and polarization state will be detected. Quantification of the depth-resolved rate of change in phase retardation is proportional to the birefringence of the tissue. The cumulative phase retardation can be expressed as an angle on a grayscale from black (0 deg) to white (180 deg). These angles are determined using a Poincaré sphere mathematical model, a construct used to display all possible polarization states of light. This model has been described in detail in previous publications32,38 and allows expression of birefringence by plotting the phase retardation angle over depth into the sample. For each individual image, the average phase retardation as a function of depth for the central 50% of regions identified as sciatic nerve was determined (Fig. 2). The central region of the nerve was identified manually in five frames (at every 50th frame), and these points were then fit with a low-order polynomial to determine the surface boundary in every frame. The slope of the corresponding phase retardation graphs starting at the nerve surface, after correcting for the presence of the epineurium surrounding the axons, was calculated by linear least squares fitting. The resulting 200 slopes for each imaged volume were then averaged into a single value per nerve to yield a measure of the birefringence of the nerve. These numerical expressions of birefringence were then compared directly with known histomorphological measurements.
Fig. 2.
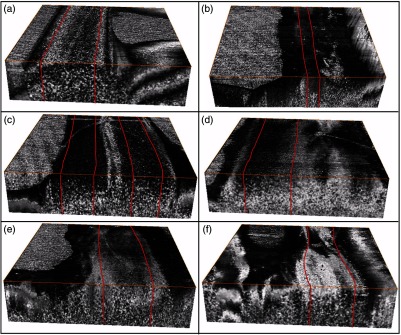
Volume render of three-dimensional PS-OCT data (covering a region) with the area corresponding to the central 50% of the sciatic nerve used to quantify the average phase retardation outlined in red for (a) control, (b) nerve transection, (c)–(f) 1 to 4 weeks postnerve crush injury.
3. Results
3.1. Functional Analysis
Initial loss of function followed by recovery over time was demonstrated in all animals on calculation of the SFI. While initially a slow process following assessment at weeks 1 and 2, the SFI was seen to rapidly approach normal at weeks 3 and 4. Walking track analysis at weeks 1 and 2 following injury revealed a mean SFI and corresponding standard deviation of () and (), respectively, representing minimal recovery/remyelination of the sciatic nerve. Greater functional recovery was represented at weeks 3 and 4 with a mean SFI recorded of () and (), respectively. While not specific to the degree of myelination, these data demonstrate the functional loss and subsequent recovery of the nerve model used.
3.2. Histology and Histomorphometry
Histomorphometric analysis was undertaken for all nerve samples including controls following imaging and upon embedding. There was noted degeneration through week 2 with subsequent myelin regeneration across all samples in the later groups. Samples were analyzed and markers of axonal myelination were calculated as described in Sec. 2.3.2. The myelin thickness and -ratio with standard deviations range from the transected nerves ( and , respectively) to the regenerating nerve at week 4 ( and , respectively) following injury.
3.3. Polarization Sensitive-Optical Coherence Tomography
Following exposure of the sciatic nerve, the crush site was identified by locating the microsuture placed at the time of injury. A portable handpiece was mounted a fixed distance above the nerve, and an area of was imaged across the crush site using PS-OCT. Figure 3 displays the results obtained from a normal nerve. Figure 3(a) displays a representative image of the backreflected intensity of light on a logarithmic grayscale taken from the imaged volume, and the position of the nerve with the surrounding muscle is evident. Figure 3(b) is the corresponding image of the cumulative phase retardation relative to the surface of the tissue. This grayscale image characterized by rapid changes from black to white indicates a strong tissue birefringence which is quantified and expressed as a depth-resolved phase retardation graph as shown in Fig. 3(c). This graph displays data averaged over the entire imaged volume. After allowing for the thickness of the epineurium in the first few microns,33 the initial slope of this graph indicated by the red line () provides a quantifiable measurement of birefringence. Figure 3(d) is an image of the corresponding histological section. The dark myelin sheaths surrounding individual axons are clearly evident.
Fig. 3.
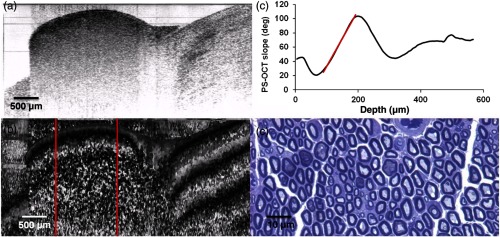
Normal sciatic nerve: (a) normal and (b) polarization-sensitive OCT images, (c) plot of average phase retardation as a function of depth (slope of ), and (d) corresponding histology.
A progression of data obtained from nerves at weeks 1 to 4 is shown in Figs. 4–7. For brevity, only the results of Fig. 5 will be described in detail. Figure 5 shows representative data of a nerve 2 weeks following injury. In this particular case, the nerve remains somewhat more embedded within the surrounding tissue and cannot be easily delineated from the intensity image [Fig. 5(a)]. However, the outer boundaries of the nerve can be observed in the corresponding phase retardation image [Fig. 5(b)], as can a significant reduction in birefringence. This effect can be quantified by the initial slope () of the depth-resolved cumulative phase retardation plot shown in Fig. 5(c). A reduction in myelination can also be appreciated in the histological section, as the thickness of the dark myelin bands surrounding the axons is visibly thinner due to Wallerian degeneration.39
Fig. 4.
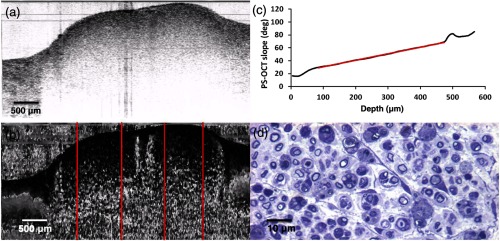
Sciatic nerve, 7 days postinjury: (a) normal and (b) polarization-sensitive OCT images, (c) plot of average phase retardation as a function of depth (slope of ), and (d) corresponding histology.
Fig. 5.
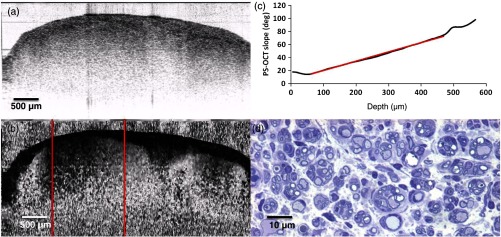
Sciatic nerve, 14 days postinjury: (a) normal and (b) polarization-sensitive OCT images, (c) plot of average phase retardation as a function of depth (slope of ), and (d) corresponding histology.
Fig. 6.
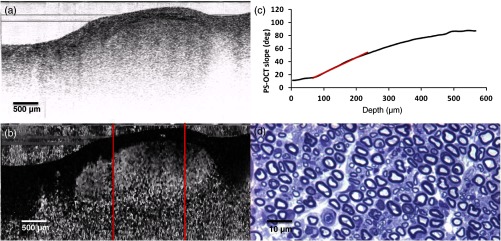
Sciatic nerve, 21 days postinjury: (a) normal and (b) polarization-sensitive OCT images, (c) plot of average phase retardation as a function of depth (slope of ), and (d) corresponding histology.
Fig. 7.
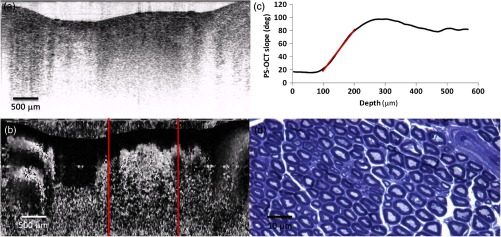
Sciatic nerve, 28 days postinjury: (a) normal and (b) polarization-sensitive OCT images, (c) plot of average phase retardation as a function of depth (slope of ), and (d) corresponding histology.
The effects of complete nerve transection are shown in Fig. 8. Nerves in this group experienced complete or nearly complete loss of myelin, as can be observed in the histological image [Fig. 8(d)]. This is reflected in the optical measurement of birefringence, as determined by the slope of the initial portion of the depth-resolved plot of phase retardation ().
Fig. 8.
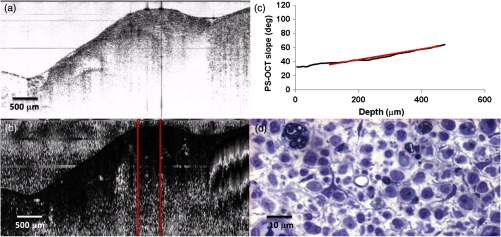
Sciatic nerve, 14 days following transection: (a) normal and (b) polarization-sensitive OCT images, (c) plot of average phase retardation as a function of depth (slope of ) and (d) corresponding histology.
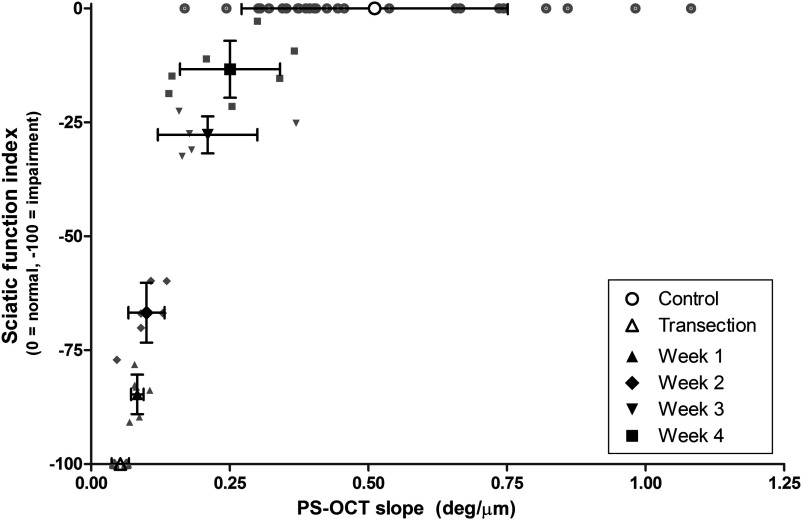
Comparison of the SFI to the PS-OCT derived slope, which is proportional to birefringence, showed that SFI increases monotonically as a function of PS-OCT slope (Fig. 9). Data points for which the polarization state of light reflected off the surface of the nerve could not be accurately determined and in which the suture could not be clearly identified were removed from this analysis, resulting in 27 animals.
Fig. 9.
Sciatic function index (SFI) versus PS-OCT slope. SFI and PS-OCT slope increase with time postinjury.
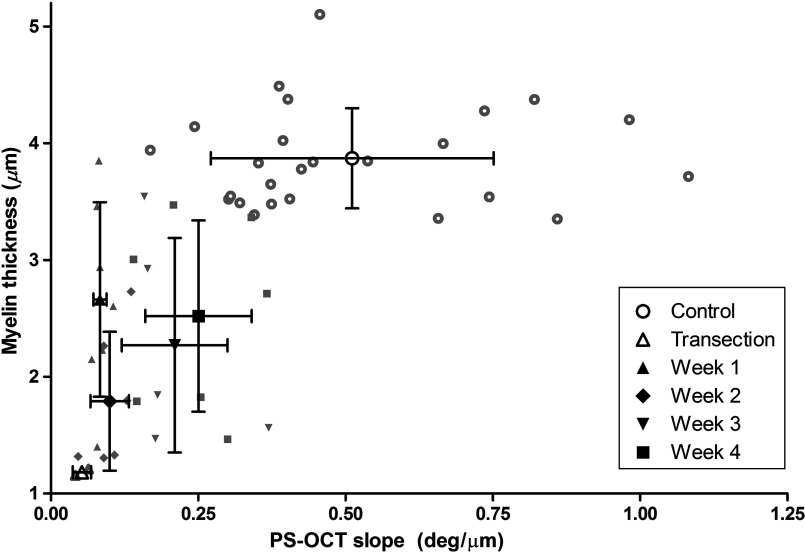
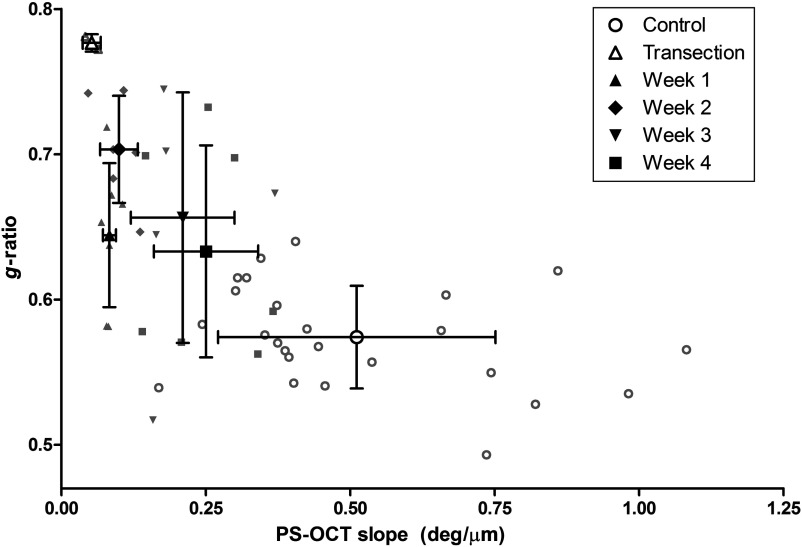
Relationships between PS-OCT derived slope and the histologically determined myelin thickness and -ratio are shown in Figs. 10 and 11. Generally, these parameters demonstrated an increasing or decreasing trend, respectively, as functions of PS-OCT slope with the exception of week 1. Both histomorphometric parameters show myelin degeneration occurring through week 2, at which point the myelin thickness reached its smallest value and the -ratio was largest in the nerve crush group. In contrast, the PS-OCT slope was smallest at week 1, suggesting that myelin actively undergoing degeneration does not contribute to the birefringence and thus can be used to provide a more accurate measure of viable myelin thickness and integrity during early time points.
Fig. 10.
Myelin thickness versus PS-OCT slope. Myelin degeneration occurred through week 2, followed by myelin regeneration.
Fig. 11.
-ratio versus PS-OCT slope.
4. Discussion
Achieving quantitative analysis and accurately assessing axonal myelination have obvious advantages in clinical practice for both prognostic and diagnostic evaluations of the nerve. Reducing often long periods of observation currently in practice following nerve contusion would allow for an earlier reassessment of the need for surgical intervention if necessary and ultimately an improved functional recovery. Diagnostically, the ability to quantify axonal myelination would be useful clinically following both traumatic injury and that of chronic pathologies such as carpal tunnel compression and demyelinating neuropathies. Despite years of advancement in optical technologies and clinical imaging, there remains no reliable method of assessing the microenvironment of the nerve. Current technology is either limited in the early phase of nerve injury, reliant on fluorescent labeling that is of limited clinical practicality, or of a nonspecific nature. Indeed, the ability of PS-OCT to image without extrinsic labeling has been one of the reasons for its increasingly widespread application in both experimental and clinical settings.
Of the endpoints available in the field of neuroscience, we chose to examine axonal myelination as a true marker of neural health. While birefringence is often exhibited by fibrous biological structures, not all such structures exhibit an appreciable amount of birefringence. Nonmyelinated axons possess very little birefringence, as demonstrated by the optical measurements of the transected nerve (group 5). Form birefringence in fibrous structures is a combination of the density of the fibers with their overall degree of organization. In dermatological applications, this can lead to some degree of variability as a loss in birefringence can be attributed to either a decrease in the density of dermal collagen or an increase in the disorganization of existing fibrils.40 The overall orientation of the myelin sheaths is dictated by that of the axons. The known disorganization of axons in Wallerian degeneration41–43 is the probable reason for the decreased birefringence despite the histologically observed presence of myelin during week 1. At the other time points, where organization of the axons is assumed, the birefringence of the sciatic nerve is presumably directly related to the amount of myelin.
For this study, we demonstrated the complete functional loss of the nerve crush injury along with subsequent recovery over time by means of standardized walking track analysis with calculation of a SFI. This allowed for a wide spectrum of functionally impaired nerves to be examined in this study. Figure 9 depicts the averaged slopes compared with the average SFI for control, transected, and injured nerves at the four time points. This plot demonstrates a clear relationship between the noncontact optical measurement of neural myelination described in this manuscript and a functionally derived measure. Figures 10 and 11 show the corresponding plots of average PS-OCT slope compared with myelin thickness and -ratio. While the error in PS-OCT slope determination increases as a function of time, the mean and error bars of the PS-OCT slope allow for a better differentiation of the control at 7, 14, and 21 day time points compared with histological parameters as shown in Figs. 10 and 11. The error bars can be attributed to sampling in the following way. Since histological measures were obtained by sampling a few randomly chosen and discrete locations, they can be subject to a large degree of variability. However, PS-OCT measures the overall birefringence of a particular region and is thus less sensitive to local sampling errors. In this study, we chose to correlate PS-OCT with standard histomorphometry and in particular, markers of axonal myelination. Correlation of the PS-OCT images to electrical studies remains an avenue of investigation we plan to pursue in a clinical study rather than in this small animal model.
In this study, we have demonstrated that PS-OCT can be used as a reliable in vivo, nondestructive method of assessing axonal myelination. Preservation of the neural microenvironment while achieving a quantitative analysis of myelin shows promise for the translation of this imaging modality to clinical practice and for further expansion in the field of experimental neuroscience. For the purpose of this investigation, we chose to access the sciatic nerve of the Sprague Dawley via a muscle splitting incision. While this may be appropriate in cases of perioperative neuronal assessment, a more minimally invasive method of assessment would be more suitable prior to clinical trial, particularly if used as a diagnostic tool without operative intervention. OCT as an imaging modality has been used previously in conjunction with fiber optic technology. In this case, delivery was achieved via an endoscope44 or in the case of intravascular studies, through a vascular catheter,45 thus allowing for translation across to endoscopic neural assessment with ease.
These results show that we have demonstrated, by means of direct histological correlation, the ability of PS-OCT to assess and quantify markers of axonal myelination in a nondestructive, in vivo manner. Exploring the realm of optical microscopy in this manner has several advantages over previous techniques in print. Both MRI3–9 and ultrasound1,2 lack the resolution or specificity of PS-OCT and, while providing structural imaging, they lack the quantitative capabilities shown here. PS-OCT remains a promising tool in this field and provides an insight into the in vivo neural microenvironment previously unseen.
5. Conclusion
In conclusion, utilizing PS-OCT allows for a nondestructive assessment of axonal myelination by optical microscopy in a manner which has not been previously reported. In this initial study, we have demonstrated PS-OCT as a reliable diagnostic and prognostic tool which shows great promise for its continued use both clinically and experimentally in the field of neuroscience.
Acknowledgments
The authors gratefully acknowledge the support from the Department of Defense, Medical Free Electron Laser Program FA9550-04-1-0079 and The Center for Integration of Medicine and Innovative Technology (CIMIT) grant 2007A003268. Technology development was supported in part by the National Institutes of Health under grant R01-019768. Dr. Henry gratefully acknowledges support from the Bullock-Wellman Fellowship, awarded by the Wellman Center for Photomedicine and The Health, Science and Technology Division (HST) of Harvard Medical School. Dr. Park gratefully acknowledges support from the National Institutes of Health under grant K99/R00-EB007241. Carissa Rodriguez gratefully acknowledges the support from the National Science Foundation IGERT Fellowship DGE 00903667. The authors gratefully acknowledge the assistance of Ms. Peggy Sherwood for histological processing, David Zurakowski, PhD, for statistical analysis, and Christopher L. Passaglia, PhD, for critical review of the manuscript.
Biography
Biographies for the authors are not available.
References
- 1.Prinz R. A. D., et al. , “Experimental chronic entrapment of the sciatic nerve in adult hamsters: an ultrastructural and morphometric study,” Braz. J. Med. Biol. Res. 36(9), 1241–1245 (2003). 10.1590/S0100-879X2003000900015 [DOI] [PubMed] [Google Scholar]
- 2.Stuart R. M., Koh E. S. C., Breidahl W. H., “Sonography of peripheral nerve pathology,” Am. J. Roentgenol. 182(1), 123–129 (2004). 10.2214/ajr.182.1.1820123 [DOI] [PubMed] [Google Scholar]
- 3.Bendszus M., Stoll G., “Caught in the act: in vivo mapping of macrophage infiltration in nerve injury by magnetic resonance imaging,” J. Neurosci. 23(34), 10892–10896 (2003). [DOI] [PMC free article] [PubMed] [Google Scholar]
- 4.Bendszus M., Stoll G., “Technology insight: visualizing peripheral nerve injury using MRI,” Nat. Clin. Pract. Neurol. 1(1), 45–53 (2005). 10.1038/ncpneuro0017 [DOI] [PubMed] [Google Scholar]
- 5.Bendszus M., et al. , “Assessment of nerve degeneration by gadofluorine M-enhanced magnetic resonance imaging,” Ann. Neurol. 57(3), 388–395 (2005). 10.1002/(ISSN)1531-8249 [DOI] [PubMed] [Google Scholar]
- 6.Kobayashi S., et al. , “Imaging of intraneural edema by using gadolinium-enhanced MR imaging: experimental compression injury,” Am. J. Neuroradiol. 26(4), 973–980 (2005). [PMC free article] [PubMed] [Google Scholar]
- 7.Wessig C., Bendszus M., Stoll G., “In vivo visualization of focal demyelination in peripheral nerves by gadofluorine M-enhanced magnetic resonance imaging,” Exp. Neurol. 204(1), 14–19 (2007). 10.1016/j.expneurol.2006.09.022 [DOI] [PubMed] [Google Scholar]
- 8.Wessig C., et al. , “Gadofluorine M-enhanced magnetic resonance nerve imaging: comparison between acute inflammatory and chronic degenerative demyelination in rats,” Exp. Neurol. 210(1), 137–143 (2008). 10.1016/j.expneurol.2007.10.014 [DOI] [PubMed] [Google Scholar]
- 9.West C. A., et al. , “Volumetric magnetic resonance imaging of dorsal root ganglia for the objective quantitative assessment of neuron death after peripheral nerve injury,” Exp. Neurol. 203(1), 22–33 (2007). 10.1016/j.expneurol.2006.07.013 [DOI] [PubMed] [Google Scholar]
- 10.Gan W. B., et al. , “Vital imaging and ultrastructural analysis of individual axon terminals labeled by iontophoretic application of lipophilic dye,” J. Neurosci. Methods 93(1), 13–20 (1999). 10.1016/S0165-0270(99)00096-5 [DOI] [PubMed] [Google Scholar]
- 11.Magill C. K., et al. , “Reinnervation of the tibialis anterior following sciatic nerve crush injury: a confocal microscopic study in transgenic mice,” Exp. Neurol. 207(1), 64–74 (2007). 10.1016/j.expneurol.2007.05.028 [DOI] [PMC free article] [PubMed] [Google Scholar]
- 12.Meyer M. P., Smith S. J., “Evidence from in vivo imaging that synaptogenesis guides the growth and branching of axonal arbors by two distinct mechanisms,” J. Neurosci. 26(13), 3604–3614 (2006). 10.1523/JNEUROSCI.0223-06.2006 [DOI] [PMC free article] [PubMed] [Google Scholar]
- 13.Wang H., et al. , “Coherent anti-stokes Raman scattering imaging of axonal myelin in live spinal tissues,” Biophys. J. 89(1), 581–591 (2005). 10.1529/biophysj.105.061911 [DOI] [PMC free article] [PubMed] [Google Scholar]
- 14.Huff T. B., Cheng J.-X., “In vivo coherent anti-Stokes Raman scattering imaging of sciatic nerve tissue,” J. Microsc. 225(2), 175–182 (2007). 10.1111/jmi.2007.225.issue-2 [DOI] [PMC free article] [PubMed] [Google Scholar]
- 15.Schuman J. S., et al. , “Quantification of nerve fiber layer thickness in normal and glaucomatous eyes using optical coherence tomography,” Arch. Ophthalmol. 113(5), 586–596 (1995). 10.1001/archopht.1995.01100050054031 [DOI] [PubMed] [Google Scholar]
- 16.Schuman J. S., et al. , “Reproducibility of nerve fiber layer thickness measurements using optical coherence tomography,” Ophthalmology 103(11), 1889–1898 (1996). 10.1016/S0161-6420(96)30410-7 [DOI] [PMC free article] [PubMed] [Google Scholar]
- 17.Schuman J. S., et al. , “Optical coherence tomography and histologic measurements of nerve fiber layer thickness in normal and glaucomatous monkey eyes,” Invest. Ophthalmol. Visual Sci. 48(8), 3645–3654 (2007). 10.1167/iovs.06-0876 [DOI] [PMC free article] [PubMed] [Google Scholar]
- 18.Huang D., et al. , “Optical coherence tomography,” Science 254(5035), 1178–1181 (1991). 10.1126/science.1957169 [DOI] [PMC free article] [PubMed] [Google Scholar]
- 19.Boppart S. A., et al. , “Real-time optical coherence tomography for minimally invasive imaging of prostate ablation,” J. Urol. 168(1), 401 (2002). 10.1016/S0022-5347(05)64972-5 [DOI] [PubMed] [Google Scholar]
- 20.Fried N. M., et al. , “Imaging the cavernous nerves in the rat prostate using optical coherence tomography,” Lasers Surg. Med. 39(1), 36–41 (2007). 10.1002/(ISSN)1096-9101 [DOI] [PubMed] [Google Scholar]
- 21.Fercher A. F., et al. , “Measurement of intraocular distances by backscattering spectral interferometry,” Opt. Commun. 117, 43–348 (1995). 10.1016/0030-4018(95)00119-S [DOI] [Google Scholar]
- 22.Hausler G., Lindner M. W., “Coherence radar and spectral radar—new tools for dermatological diagnosis,” J. Biomed. Opt. 3(1), 21–31 (1998). 10.1117/1.429899 [DOI] [PubMed] [Google Scholar]
- 23.Wojtkowski M., et al. , “In vivo human retinal imaging by Fourier domain optical coherence tomography,” J. Biomed. Opt. 7(3), 457–463 (2002). 10.1117/1.1482379 [DOI] [PubMed] [Google Scholar]
- 24.Andretzky P., et al. , “Optical coherence tomography by spectral radar: dynamic range estimation and in-vivo measurements of skin,” Proc. SPIE 3567, 78–87 (1999). 10.1117/12.339173 [DOI] [Google Scholar]
- 25.Mitsui T., “Dynamic range of optical reflectometry with spectral interferometry,” Jpn. J. Appl. Phys. 38(Part 1, No. 10), 6133 (1999). 10.1143/JJAP.38.6133 [DOI] [Google Scholar]
- 26.De Boer J. F., et al. , “Improved signal-to-noise ratio in spectral-domain compared with time-domain optical coherence tomography,” Opt. Lett. 28(21), 2067–2069 (2003). 10.1364/OL.28.002067 [DOI] [PubMed] [Google Scholar]
- 27.Choma M., et al. , “Sensitivity advantage of swept source and Fourier domain optical coherence tomography,” Opt. Express 11(18), 2183–2189 (2003). 10.1364/OE.11.002183 [DOI] [PubMed] [Google Scholar]
- 28.Leitgeb R., et al. , “Spectral measurement of absorption by spectroscopic frequency-domain optical coherence tomography,” Opt. Lett. 25(11), 820–822 (2000). 10.1364/OL.25.000820 [DOI] [PubMed] [Google Scholar]
- 29.de Boer J. F., et al. , “Two-dimensional birefringence imaging in biological tissue by polarization-sensitive optical coherence tomography,” Opt. Lett. 22(12), 934–936 (1997). 10.1364/OL.22.000934 [DOI] [PubMed] [Google Scholar]
- 30.de Boer J. F., Milner T. E., Nelson J. S., “Determination of the depth-resolved Stokes parameters of light backscattered from turbid media by use of polarization-sensitive optical coherence tomography,” Opt. Lett. 24(5), 300–302 (1999). 10.1364/OL.24.000300 [DOI] [PubMed] [Google Scholar]
- 31.de Boer J. F., Milner T. E., “Review of polarization sensitive optical coherence tomography and Stokes vector determination,” J. Biomed. Opt. 7(3), 359–371 (2002). 10.1117/1.1483879 [DOI] [PubMed] [Google Scholar]
- 32.Park B. H., et al. , “In vivo burn depth determination by high-speed fiber-based polarization sensitive optical coherence tomography,” J. Biomed. Opt. 6(4), 474–479 (2001). 10.1117/1.1413208 [DOI] [PubMed] [Google Scholar]
- 33.Islam M. S., et al. , “Extracting structural features of rat sciatic nerve using polarization-sensitive spectral domain optical coherence tomography,” J. Biomed. Opt. 17(5), 056012 (2012). 10.1117/1.JBO.17.5.056012 [DOI] [PMC free article] [PubMed] [Google Scholar]
- 34.Bridge P. M., et al. , “Nerve crush injuries–a model for axonotmesis,” Exp. Neurol. 127(2), 284–290 (1994). 10.1006/exnr.1994.1104 [DOI] [PubMed] [Google Scholar]
- 35.Bain J. R., Mackinnon S. E., Hunter D. A., “Functional evaluation of complete sciatic, peroneal, and posterior tibial nerve lesions in the rat,” Plast. Reconstr. Surg. 83(1), 129–138 (1989). 10.1097/00006534-198901000-00024 [DOI] [PubMed] [Google Scholar]
- 36.Abràmoff M. D., Magalhães P. J., Ram S. J., “Image processing with image,” Biophotonics Int. 11(7), 36–41 (2004). [Google Scholar]
- 37.Park B., et al. , “Real-time fiber-based multi-functional spectral-domain optical coherence tomography at 1.3 micron,” Opt. Express 13(11), 3931–3944 (2005). 10.1364/OPEX.13.003931 [DOI] [PubMed] [Google Scholar]
- 38.Park B., et al. , “Real-time multi-functional optical coherence tomography,” Opt. Express 11(7), 782–793 (2003). 10.1364/OE.11.000782 [DOI] [PubMed] [Google Scholar]
- 39.Waller A., “Experiments on the section of the glossopharyngeal and hypoglossal nerves of the frog, and observations of the alterations produced thereby in the structures of their primitivies fibres,” Philos. Trans. R. Soc. London 140, 423–429 (1850). 10.1098/rstl.1850.0021 [DOI] [Google Scholar]
- 40.Pierce M. C., et al. , “Collagen denaturation can be quantified in burned human skin using polarization-sensitive optical coherence tomography,” Burns 30(6), 511–517 (2004). 10.1016/j.burns.2004.02.004 [DOI] [PubMed] [Google Scholar]
- 41.Thomas P. K., “The cellular response to nerve injury. 1. The cellular outgrowth from the distal stump of transected nerve,” J. Anat. 100(2), 287–303 (1966). [PMC free article] [PubMed] [Google Scholar]
- 42.Haftek J., Thomas P. K., “Electron-microscope observations on the effects of localized crush injuries on the connective tissues of peripheral nerve,” J. Anat. 103(2), 233–243 (1968). [PMC free article] [PubMed] [Google Scholar]
- 43.Fawcett J. W., Keynes R. J., “Peripheral nerve regeneration,” Annu. Rev. Neurosci. 13, 43–60 (1990). 10.1146/annurev.neuro.13.1.43 [DOI] [PubMed] [Google Scholar]
- 44.Vakoc B. J., et al. , “Comprehensive esophageal microscopy by using optical frequency-domain imaging (with video),” Gastrointest. Endosc. 65(6), 898–905 (2007). 10.1016/j.gie.2006.08.009 [DOI] [PMC free article] [PubMed] [Google Scholar]
- 45.Yun S. H., et al. , “Comprehensive volumetric optical microscopy in vivo,” Nat. Med. 12(12), 1429–1433 (2006). 10.1038/nm1450 [DOI] [PMC free article] [PubMed] [Google Scholar]


