
Fig. 2.
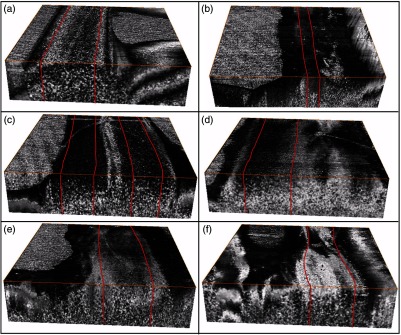
Volume render of three-dimensional PS-OCT data (covering a region) with the area corresponding to the central 50% of the sciatic nerve used to quantify the average phase retardation outlined in red for (a) control, (b) nerve transection, (c)–(f) 1 to 4 weeks postnerve crush injury.