Fig. 3.

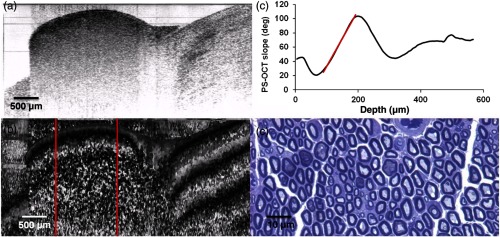
Normal sciatic nerve: (a) normal and (b) polarization-sensitive OCT images, (c) plot of average phase retardation as a function of depth (slope of ), and (d) corresponding histology.

Normal sciatic nerve: (a) normal and (b) polarization-sensitive OCT images, (c) plot of average phase retardation as a function of depth (slope of ), and (d) corresponding histology.