
Fig. 8.
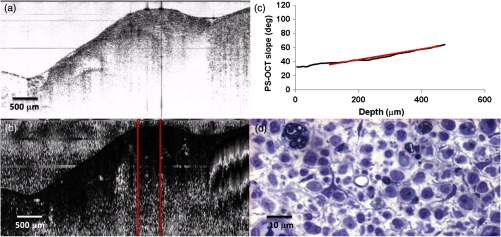
Sciatic nerve, 14 days following transection: (a) normal and (b) polarization-sensitive OCT images, (c) plot of average phase retardation as a function of depth (slope of ) and (d) corresponding histology.
Official websites use .gov
A
.gov website belongs to an official
government organization in the United States.
Secure .gov websites use HTTPS
A lock (
) or https:// means you've safely
connected to the .gov website. Share sensitive
information only on official, secure websites.
Sciatic nerve, 14 days following transection: (a) normal and (b) polarization-sensitive OCT images, (c) plot of average phase retardation as a function of depth (slope of ) and (d) corresponding histology.