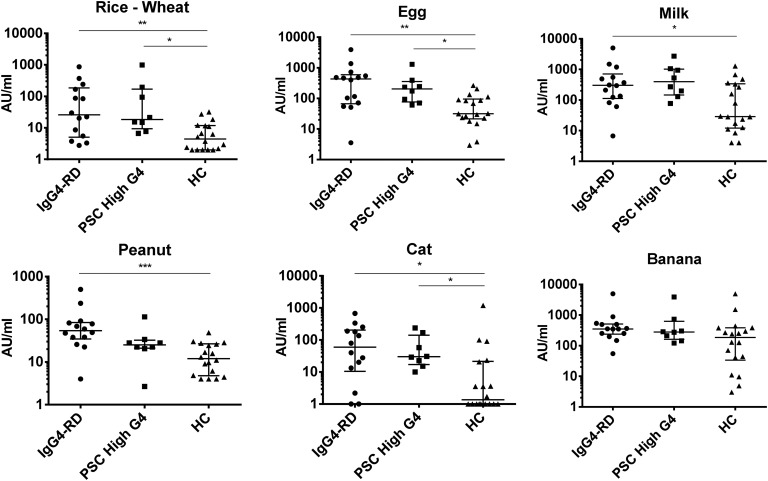
Figure 1.
The dot plots show IgG4 antigen-specific responses in treatment-naive patients with IgG4-RD, patients with PSC-high IgG4, and healthy controls. X-axis labels as shown in the figure . Antigens were rice and wheat, egg, milk, peanut, cat dander and serum, and banana. On the Y-axis is IgG4-specific antigen response, log 10 scale, in arbitrary units per mL. Error bars represent median and IQR; p values: *p<0.05, **p<0.005, ***p<0.001. HC, healthy controls; IgG4-RD, IgG4-related disease; PSC, primary sclerosing cholangitis.

