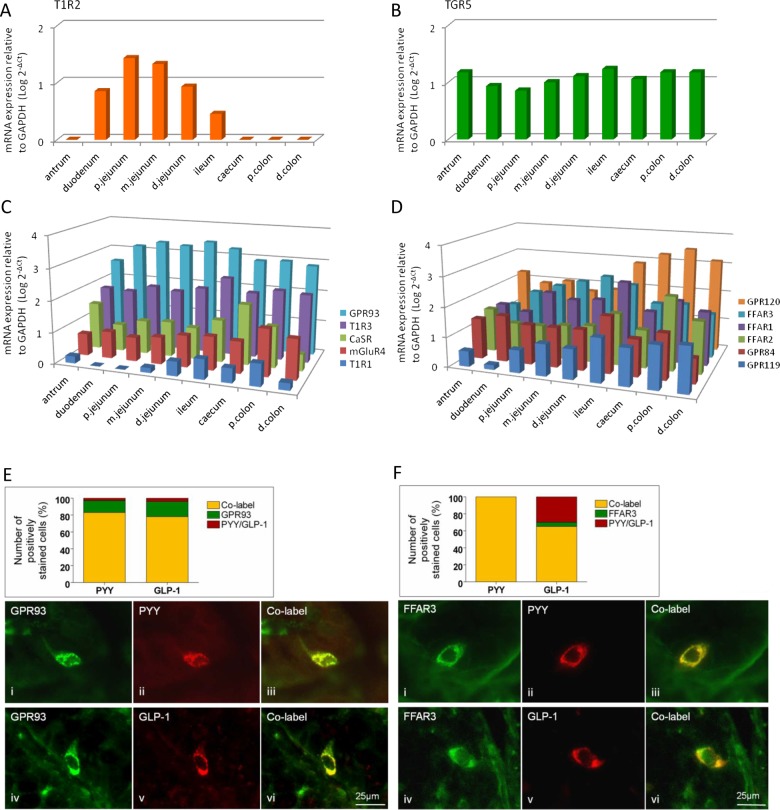
Figure 1.
Regional expression in mouse GI tract of the G-protein coupled receptors (GPCR) for carbohydrate-sweet T1R2 (A), bile acids, TGR5 (B), amino acids, GPR93, T1R3, CaSR, mGluR4 and T1R1 (C), fatty acids GRP120, FFAR3, FFAR1, FFAR2, GPR84 and GPR119 (D), relative to GAPDH (n=7 for all expression studies). (E and F) Immunolabelling in mouse proximal colon for GPR93, FFAR3, GLP-1 and PYY in mouse proximal colon. Charts represent the proportion of individual GPCRs colocalised with cells expressing GLP-1 or PYY (yellow), those with GPCR alone (green) and those with hormone alone (red).

