FIGURE 3.
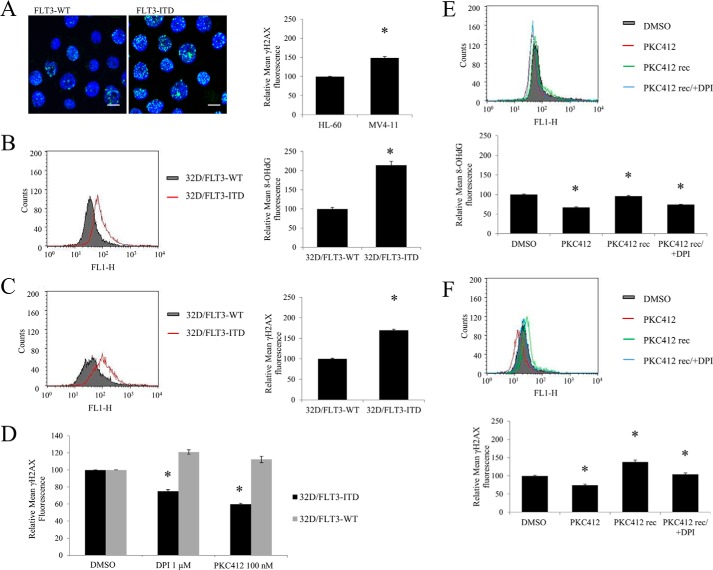
FLT3-ITD-expressing cells have increased levels of DNA oxidation and DNA double strand breaks than their wild type equivalents. The inhibition on FLT3-ITD or NOX causes a decrease in DNA damage. 32D cells were IL-3 starved overnight, followed by fixation, and γ-H2AX or 8-OHdG immunofluorescence, described in detail under “Experimental Procedures.” The analysis of the immunofluorescence was performed using confocal microscope in A or FACS in B-F. In A, the levels of DNA double strand breaks were determined in patient-derived cell lines carrying FLT3-WT (HL-60) or FLT3-ITD (MV-411) using γ-H2AX immunofluorescence. The image is a representative of FACS analysis (presented on the bar chart). The scale bar represents 10 μm. The levels of DNA oxidation as determined by 8-OHdG marker (in B) and DNA double strand breaks, using γH2AX (in C and D) were determined in the 32D cell line stably transfected with FLT3-ITD or FLT3-WT. The flow cytometric histograms show overlaid mean fluorescence of 32D/FLT3-WT cells (gray) and 32D/FLT3-ITD cells (red). In D, the 32D cells were treated for 24 h with DPI or PKC412 at the indicated concentrations. The quantified results of 3 independent experiments are shown on the bar charts on the left. In E and F, MV4-11 cells were treated with 50 nm PKC412 inhibitor for 24 h (red), followed by a PBS wash, and a 16-h recovery in the absence (green) or presence of 1 μm DPI (blue). The levels of 8-OHdG (in D) and γ-H2AX (in E) were then analyzed using flow cytometry. DMSO, dimethyl sulfoxide. The bar chart shows the relative mean 8-OHdG or γ-H2AX fluorescence normalized to the dimethyl sulfoxide-treated control (gray). The error bars represent ± S.D. The asterisk indicates the statistically significant difference (p < 0.05) as analyzed by Student's t test.

