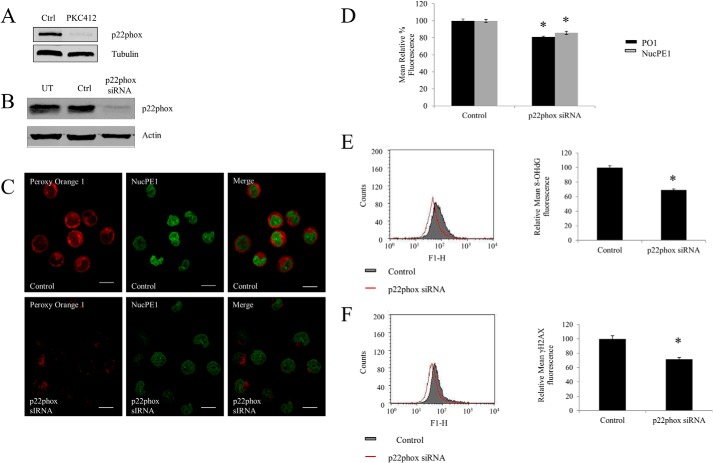
FIGURE 4.
FLT3-ITD driven p22phox mediates levels of nuclear H2O2, DNA oxidation, and DNA double strand breaks generation in FLT3-ITD expressing cells. A, Western blotting analysis of the decrease in the p22phox protein level after a 50 nm PKC412 treatment for 24 h in MV4-11 cells. B, Western blot analysis of the p22phox protein level at 24 h following the siRNA transfection. β-Actin was used as a loading control. C, confocal images of H2O2 levels following the p22phox siRNA knockdown, using probes PO1 (red) and NucPE1 (green) and their merge images. The scale bar represents 10 μm. D, flow cytometric quantification of PO1 and NucPE1 fluorescence after p22phox knockdown. E and F, flow cytometric analysis of immunofluorescence of 8-OHdG (E) and γ-H2AX (F) markers of DNA oxidation and DNA double strand breaks, respectively, in cells transfected with negative siRNA control versus cells transfected with p22phox siRNA. The bar charts show the relative mean fluorescence of p22phox siRNA-transfected cells (red) expressed as a percentage of control (gray). The mean is representative of three independent experiments. The asterisk indicates statistically significant difference (p < 0.05) as analyzed by Student's t test. The error bars represent ± S.D.

