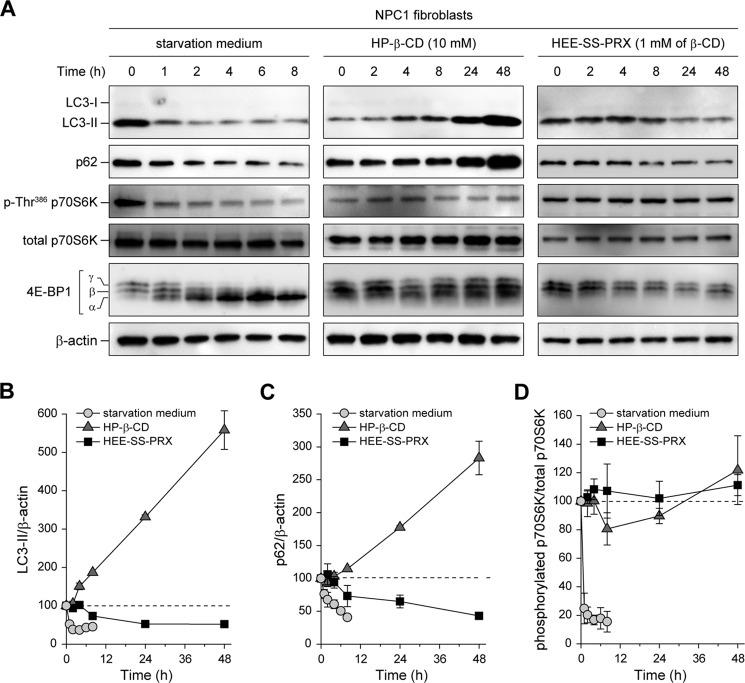
FIGURE 4.
The activity of mTORC1 in the NPC1 fibroblasts treated with HP-β-CD and biocleavable polyrotaxanes. A, time courses of the expression levels for LC3, p62, phospho-Thr386 S6K, total S6K, 4E-BP1, and β-actin in the NPC1 fibroblasts after treatment with starvation medium, HP-β-CD (10 mm), and HEE-SS-PRX (1 mm β-CD). B–D, time course of relative band intensity changes for LC3-II/β-actin (B), p62/β-actin (C), and phospho-Thr386 S6K/total S6K (D) in NPC1 fibroblasts treated with starvation medium (circles), HP-β-CD (10 mm) (triangles), and HEE-SS-PRX (1 mm β-CD) (squares) (n = 3). The values are expressed as the mean ± S.D. (error bars).

