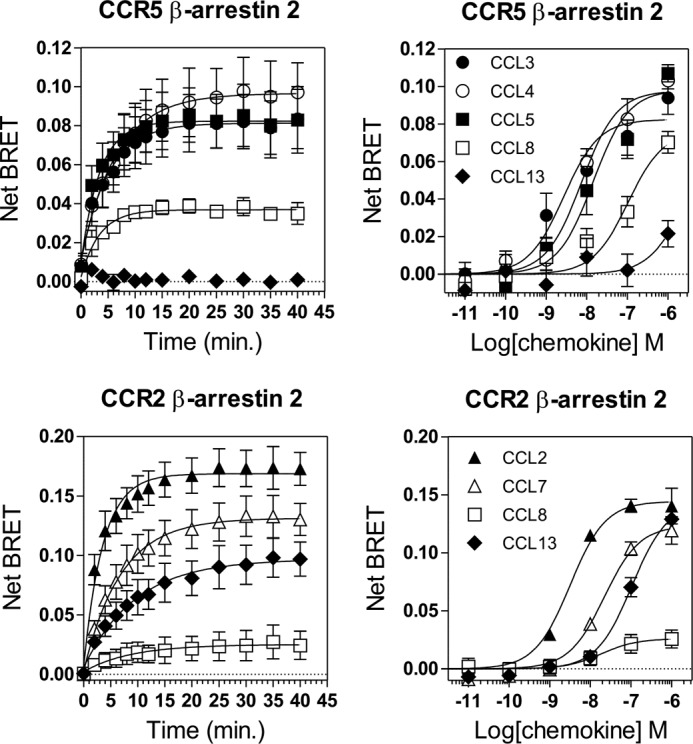
FIGURE 9.

Recruitment of β-arrestin 2 by CCR5 and CCR2. A–D, real time measurement of BRET signal in HEK293T cells expressing either β-arrestin2-RLuc8 and CCR5-Venus (A and B) or β-arrestin2-RLuc8 and CCR2-Venus (C and D) and stimulated with chemokines. For kinetics, BRET signals were measured after addition of 100 nm chemokines. For dose-response curves, BRET was recorded 30 min after stimulation with various concentrations of chemokines. The results are expressed as net BRET, corresponding to the difference in BRET signal between cells expressing arrestin plus receptor and cells expressing arrestin only. The data represent the means ± S.E. of three independent experiments.
