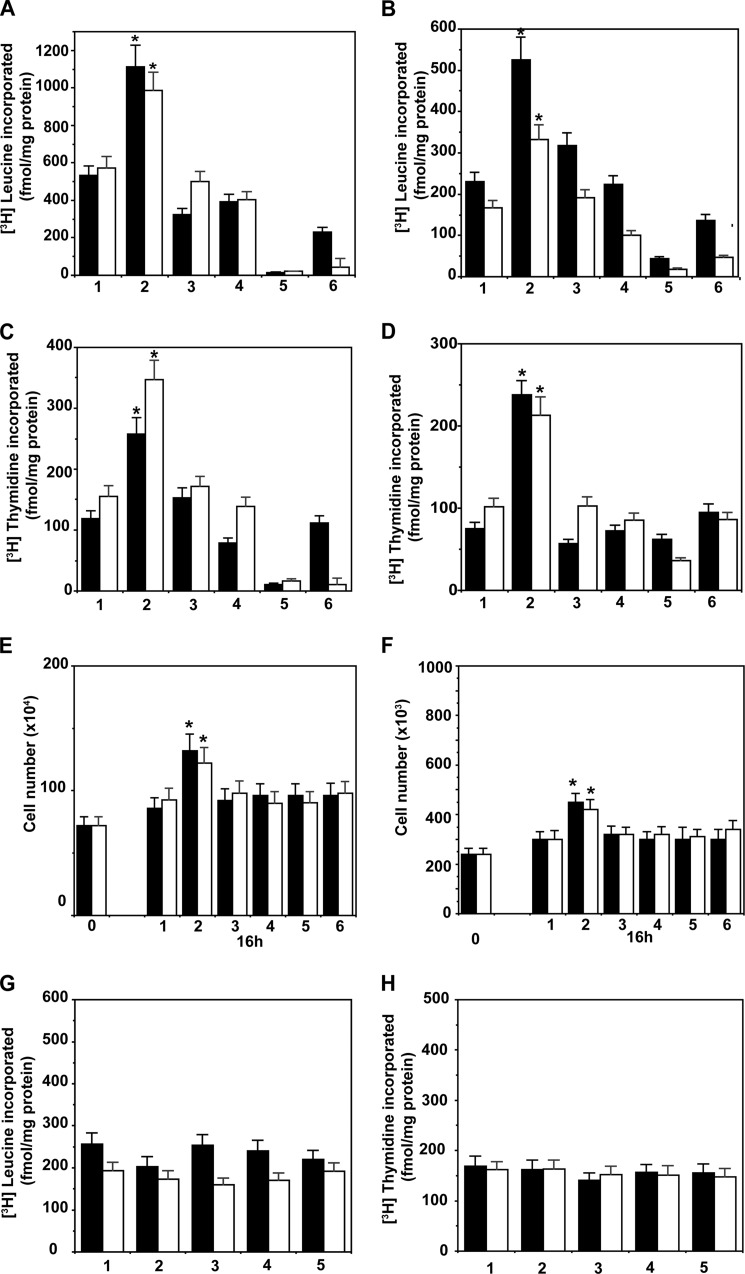
FIGURE 1.
Inhibition of α2M* (black bars) and insulin (white bars)-induced protein synthesis in 1-LN (A) and DU-145 (B) prostate cancer cells is shown. DNA synthesis for 1-LN (C) and DU-145 (D) cells, respectively, is shown. Cell growth studies are shown in E and F, respectively. The bars in A–D are as follows: 1, buffer; 2, α2M* or insulin; 3, MKK-2206 then α2M* or insulin; 4, KU0063794 then α2M* or insulin; 5, C-75 then α2M* or insulin; and 6, orlistat then α2M* or insulin. Protein synthesis data are the mean ± S.E. from three experiments. The effects of inhibitors on cell growth of 1-LN (E) and DU-145 (F) cells stimulated with α2M* (black bars) or insulin (white bars) are shown. The bars at 16 h in E and F are as above. The effects of inhibitors alone on protein synthesis (G) and DNA synthesis (H) in 1-LN (black bars) and DU-145 (white bars) prostate cancer cells are shown. The bars in both G and H are as follows: 1, buffer; 2, MKK-2206; 3, KU0063794; 4, C-75; and 5, orlistat. The values in G and H are the mean ± S.E. from three experiments. Values significantly different at 5% level from buffer or inhibitor-treated cells are marked with an asterisk.

