FIGURE 3.
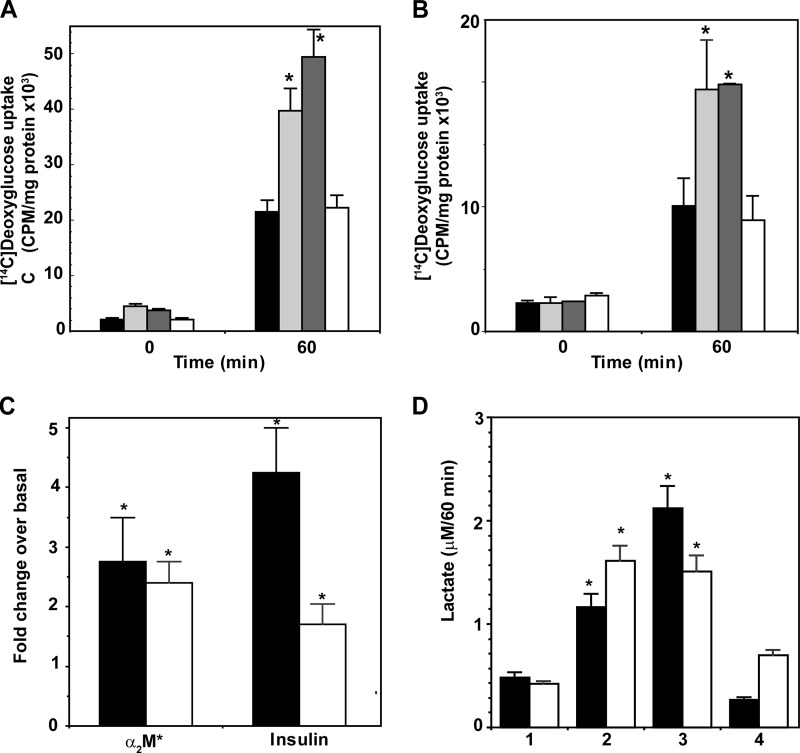
1-[14C]Deoxyglucose uptake by 1-LN (A) and DU-145 (B) cells is shown. 1-[14C]Deoxyglucose uptake in cells treated with buffer (black bars), α2M* (light gray bars); insulin (dark gray bars), or anti-CTD antibody then α2M* for 60 min (white bars) is shown. 1-[14C]Deoxyglucose uptake is expressed as cpm/mg/supernatant and is the mean ± S.E. from four experiments. Values significantly different at the 5% level at the 60-min period from buffer and anti-CTD are indicated by an asterisk. C, Glut-mRNA levels determined by real time PCR in 1-LN (black bars) and DU-145 (white bars) cells treated with α2M* or insulin. Glut-1 mRNA levels are expressed as fold change over mRNA levels in buffer-treated cells and are significantly different (asterisk) at 5% levels from buffer-treated cells and are denoted by an asterisk. D, lactate secretion in1-LN (black bars) and DU-145 (white bars) cells treated with the following: 1, buffer; 2, α2M*; 3, insulin; or 4, anti-CTD then α2M*. Lactate secretion is expressed as micromolars/60 min and is the mean ± S.E. from three experiments. Values significantly different at the 5% level from buffer and anti-CTD-treated cells are indicated by an asterisk.

