FIGURE 6.
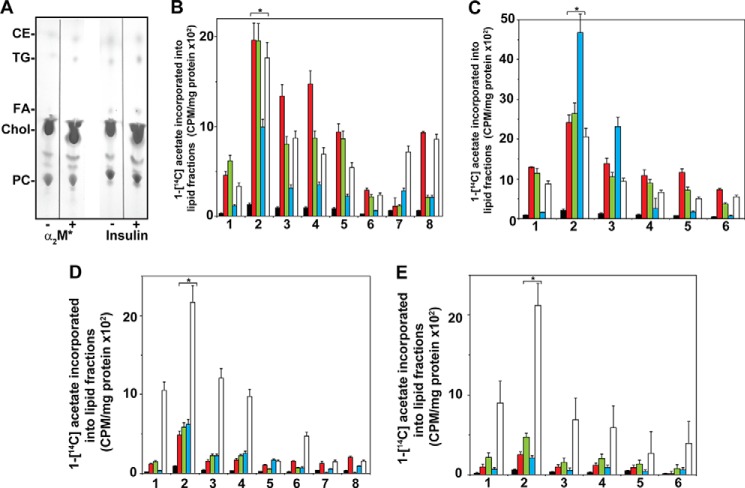
Thin layer chromatography of 1-[lsqb]14C]acetate-labeled lipid extracts of 1-LN and DU-145 cells treated with α2M* or insulin. A, representative thin layer chromatogram of cell lipids of 1-LN cells. A similar pattern was obtained with DU-145 cells (data not shown). B, fatty-acid synthase inhibitors inhibit α2M-induced increased incorporation of 1-[14C]acetate into esterified cholesterol (black) triglycerides (red), fatty acids (green), cholesterol (blue), and phosphatidylcholine (white) fractions of 1-LN cells. The bars are in the figure are as follows: 1, buffer; 2, α2M*; 3, LY294002 and then α2M*; 4, rapamycin and then α2M*; 5, torin and then α2M*; 6, C-75 and then α2M*; 7, KU0063794 and then α2M*; 8, anti-CTD and then α2M*. C, inhibition of insulin-induced increase 1-[14C]acetate incorporation into cellular lipids fraction of 1-LN cells by prior treatment of cells with fatty-acid synthase inhibitors. Bars in the figure are as in B except treatment with anti-CTD or KU0063794, which was not performed. Fatty-acid synthase inhibitors suppress α2M* (D) and insulin-induced increase (E) of [14C]acetate incorporation into cellular lipids of DU-145 cells. The bars in figure in D are the same as in B, and the bars in figure in E are the same as in C. The incorporation of 1-[14C]acetate into various lipid fractions in B–E is expressed as cpm/mg protein and is mean ± S.E. from three experiments. Values significantly different at 5% levels from buffer and inhibitor-treated cells in B–E are denoted by an asterisk.

