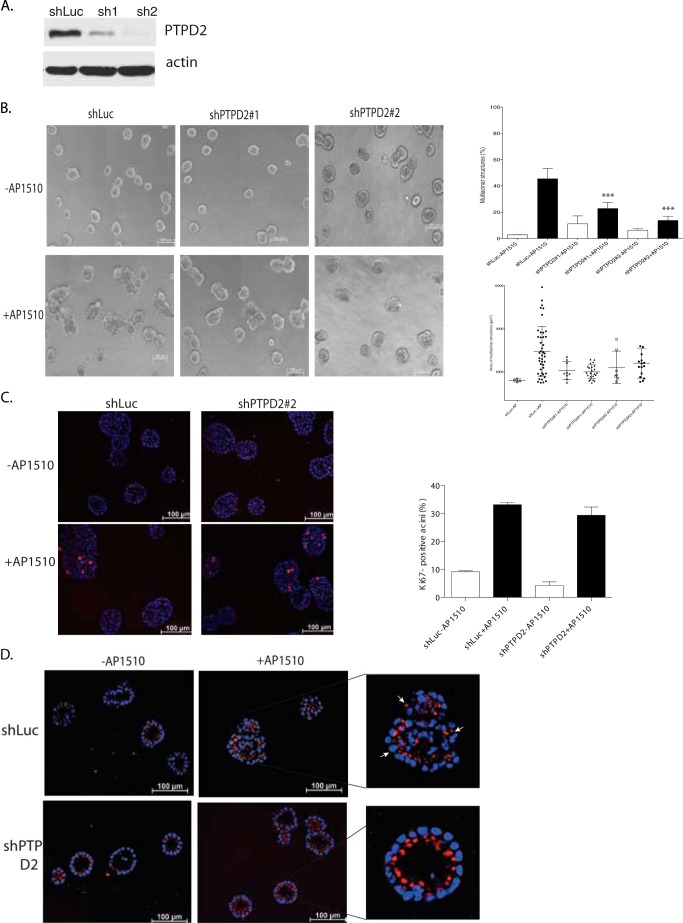
FIGURE 2.
Suppression of PTPD2 inhibited the AP1510-induced phenotype in three-dimensional cultures. a, immunoblot showing the PTPD2 protein level in 10A.B2 cells expressing control or individual shRNAs targeting PTPD2. The expression of β-actin was used as the loading control. b, representative phase-contrast images of acinar structures, expressing the indicated shRNAs and treated with AP1510 or vehicle control for 12 days (left). For quantitation of the multiacinar phenotype, data are expressed as percentage of acini that form multiacinar structures ± S.E. (***, p < 0.0005) (right, top). Size distribution of multiacinar structures are expressed as area in μm2 (right, bottom). c, representative images of acinar structures stimulated with AP1510 or vehicle and immunostained for proliferation marker Ki67 (red). Nuclei were costained with DAPI in blue (left). Quantitation of Ki67-positive acini are indicated (right). d, representative images of cross-sections of acinar structures stimulated with AP1510 or vehicle control and immunostained for cis-Golgi marker GM130 (red). Nuclei were costained with DAPI in blue. Inset shows the representative AP1510-stimulated structures with arrows indicating mislocalization of GM130 to lateral or basal surfaces. Scale bar represents 100 μm.

