
FIGURE 2.
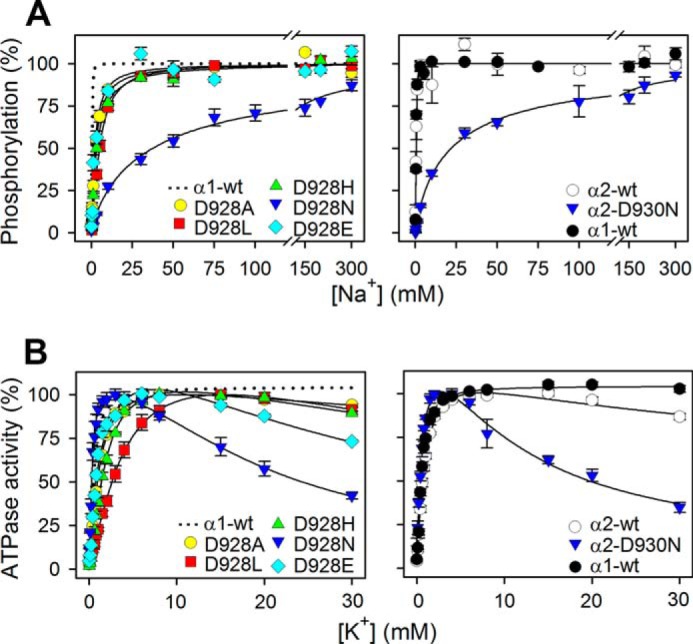
Na+ and K+ dependences of M8 aspartate mutants. A, phosphorylation was carried out for 10 s at 0 °C in 20 mm Tris (pH 7.5), 3 mm MgCl2, 1 mm EGTA, 2 μm [γ-32P]ATP, 10 μm ouabain, 20 μg oligomycin/ml, and the indicated concentration of Na+, added as NaCl with various concentrations of N-methyl-d-glucamine to maintain the ionic strength. Each line represents the best fit of a Hill function (see Equation 1 of “Experimental Procedures”) with extracted K0.5 values and Hill coefficients being listed in Table 1. B, ATPase activity was measured at 37 °C in 40 mm NaCl, 3 mm ATP, 3 mm MgCl2, 30 mm histidine (pH 7.4), 1 mm EGTA, 10 μm ouabain, and K+ concentrations as indicated, added as KCl. K0.5 values for the rising parts of the curves are listed in Table 1. For direct comparison, the dotted line in the left panel reproduces the data for α1 wild type from the corresponding right panel. Error bars indicate mean ± S.E. (seen only when larger than the size of the symbols).