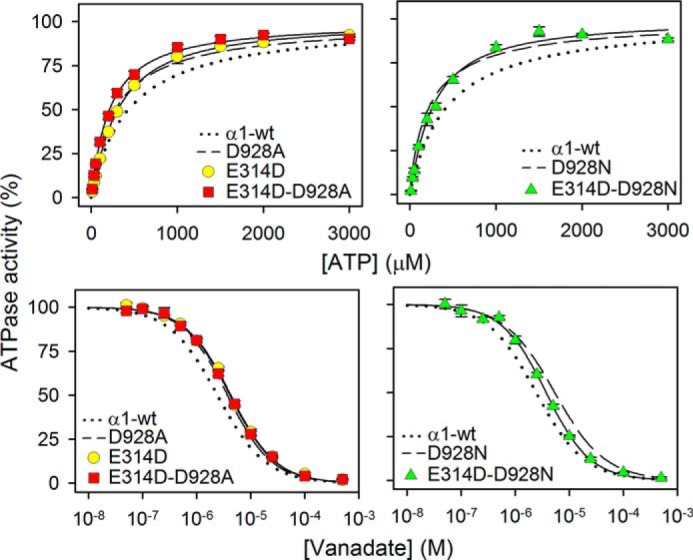
FIGURE 6.

ATP and vanadate dependences of Na+,K+-ATPase activity of E314D/D928A and E314D/D928N. Data were obtained and analyzed as for Fig. 3. Extracted K0.5 values are listed in Table 1. The dotted and broken lines reproduce wild type and mutant data from Fig. 3 for direct comparison. Error bars indicate mean ± S.E. (seen only when larger than the size of the symbols).
