FIGURE 7.
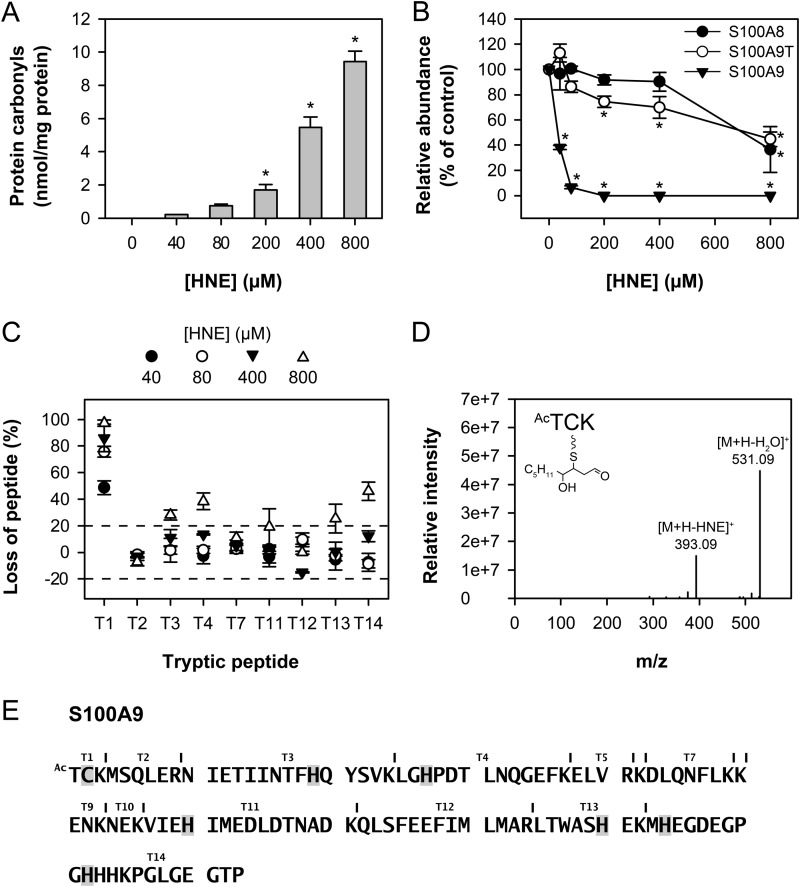
Modification of calprotectin by HNE. Calprotectin (40 μm) was treated with various concentrations of HNE (0–800 μm). A, protein carbonyl measurement of HNE-treated calprotectin. The protein carbonyls formed were derivatized with 2,4-dinitrophenylhydrazine and detected by ELISA. Values represent the means ± S.E. of three separate experiments. A significant difference with the control (0 μm HNE) is indicated by *. B, loss of calprotectin subunits induced by HNE treatment. Samples were analyzed using MALDI-TOF MS. The peak height was determined for each subunit, and the relative loss of each subunit was calculated as compared with the control sample for each HNE concentration using S100A12 as an internal standard as it contains no cysteine residues. S100A9T = truncated S100A9. Values represent the means ± S.E. of three experiments. A significant difference (p < 0.05, one-way analysis of variance, Dunnett's test) with the control (0 μm HNE) is indicated by *. C, loss of calprotectin tryptic peptides induced by HNE. Treated protein samples were digested with trypsin overnight and subsequently analyzed using MALDI-TOF MS (or LC/ESI-MS for detection of peptide T1). The peak height response (or product ion peak area response for LC/ESI-MS samples) was determined for each peptide, and the relative loss of each peptide was calculated as compared with the control sample for each HNE concentration. Values represent the means ± S.E. of three separate experiments. Tryptic peptides T1, T3, T4, T13, and T14 were characterized by loss greater than the threshold level (set as 20%). Peptides are labeled as in E. D and E, HNE-modified S100A9 amino acids. Treated protein samples were digested with trypsin overnight and subsequently analyzed by LC/ESI-MS. The m/z values of singly and multi-charged state ions corresponding to S100A9 peptides with residues modified by HNE (cysteine, histidine, or lysine) were predicted and matched to LC/ESI-MS fragmentation data (data not shown). The fragmentation pattern of the N-acetyl-TCK-HNE peptide is shown in D. The MS/MS spectrum was acquired from the ion of m/z 549.18 (+1 ion) eluting at 26.94 min. Ac = acetylation. Residues determined to be modified by HNE are highlighted in E.

