
FIGURE 1.
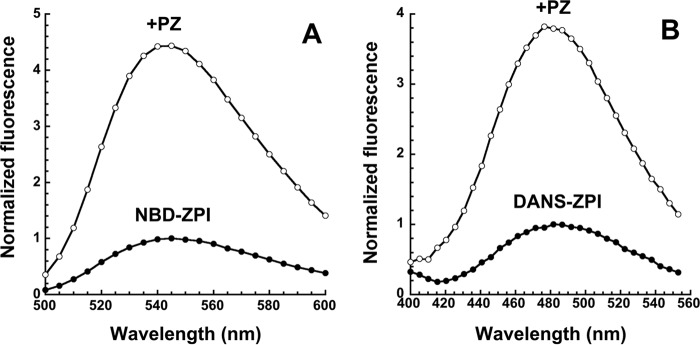
Emission spectra of fluorescently labeled ZPIs and their complexes with protein Z. A, emission spectra of 100 nm NBD-K239C ZPI in pH 7. 1, I 0.15 Tris buffer at 25 °C were taken with excitation at 480 nm in the absence and presence of 300 nm PZ. Corrections were made for background signal of buffer ±PZ and for PZ dilution, and then spectra were normalized to the maximum fluorescence of free labeled ZPI as described under “Experimental Procedures.” B, emission spectra of 100 nm DANS-K239C ZPI were taken in pH 7.1, I 0.15 buffer with excitation at 292 nm in the absence and presence of 230 nm PZ, corrected for buffer and PZ, and normalized as in A.