
FIGURE 10.
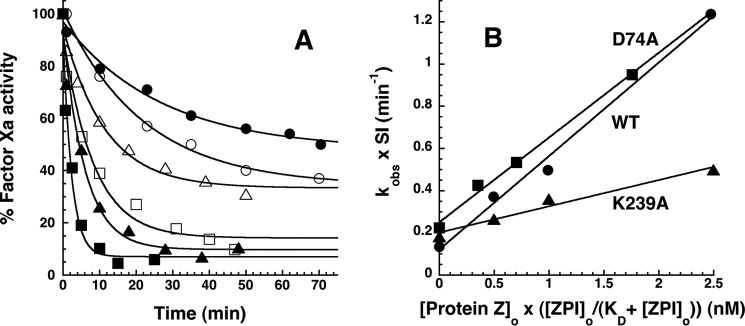
Effect of catalytic PZ on the kinetics of wild-type and variant ZPI-factor Xa reactions. A, progress curves are shown for reactions of 200 nm wild-type (closed symbols) or K239A ZPI (open symbols) with 6 nm factor Xa in the absence (circles) and presence of 1 (triangles) and 2. 5 nm (squares) PZ at 25 °C in pH 7.4 Tris buffer, I 0.15 containing 5 mm calcium and 25 μm phospholipid. Solid lines are fits by a single exponential function with nonzero end point. The end points progressively decrease with increasing PZ concentration because acylation and deacylation rates for formation and dissociation of the ZPI-PZ complex are comparable in the absence of PZ, whereas acylation is favored in the presence of PZ (4). B, dependence of SI-corrected kobs values for reactions of 200 nm wild-type (●), K239A (▴), and D74A (■) ZPIs with 6 nm factor Xa on PZ concentration corrected for the fraction of PZ bound to ZPI based on KD values reported in Table 2. kobs was obtained from exponential fits of the reaction progress curves in A and others not shown for the indicated ZPI-factor Xa reactions. SI corrections of kobs were made by summing the products, kobs × SI, for uncatalyzed and PZ-catalyzed contributions to the measured kobs based on SIs reported in Table 1 and Ref. 18. Solid lines are linear regression fits from which second order association rate constants for PZ catalysis of the ZPI-factor Xa reactions were obtained.