
FIGURE 5.
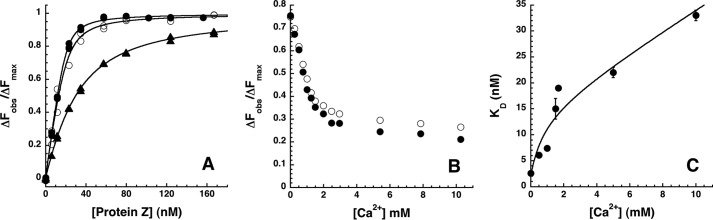
Calcium ion effects on the ZPI-PZ interaction. A, equilibrium binding titrations of 25 nm NBD-ZPI with PZ in pH 7. 1, I 0.15 Tris buffer at 25 °C (●) without or with the addition of 15 mm NaCl (○) or 5 mm CaCl2 (▴). Observed changes in fluorescence corrected for buffer and dilution are expressed relative to the fitted maximal fluorescence change. Solid lines are fits of data by the quadratic binding equation. B, titrations of NBD-ZPI-PZ complex formed with 26 nm labeled ZPI and 26 nm PZ with CaCl2 in pH 7.1, I 0.15 Tris buffer at 25 °C. Observed fluorescence changes were corrected for buffer and dilution as well as for minor scattering changes in control titrations with buffer lacking CaCl2 and expressed relative to the fitted maximal fluorescence change in separate titrations of NBD-ZPI with PZ under identical conditions. Closed and open circles represent replicate titrations. C, dependence of KD measured in equilibrium binding titrations of 25 nm NBD-ZPI with PZ in pH 7.1, I 0.15 buffer containing the indicated fixed concentrations of CaCl2. The solid line is a fit of data by Equation 3 under “Experimental Procedures” that relates specific calcium ion binding to NBD-ZPI and/or PZ and ionic strength effects of calcium to complex affinity. Error bars represent ±S.E.