
FIGURE 9.
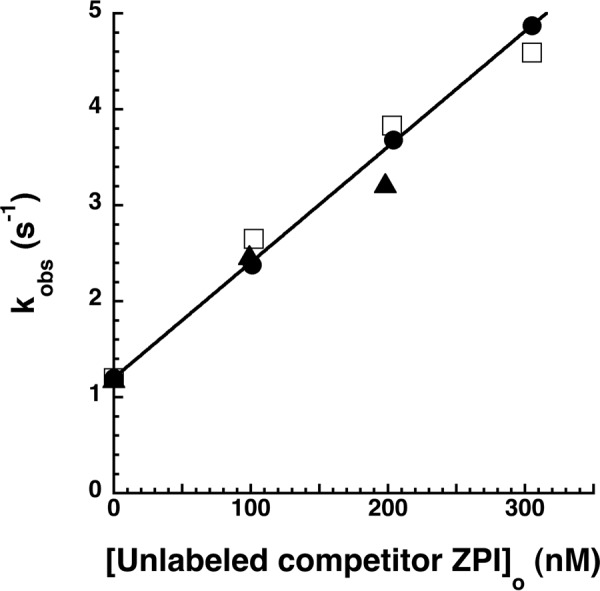
Kinetics of competitive binding of unlabeled and NBD-labeled ZPIs to PZ. NBD-ZPI (100 nm) was mixed with 20 nm PZ in the absence and presence of increasing concentrations of unlabeled wild-type intact (●) or cleaved (□) ZPI or K239A ZPI (▴). Averaged reaction traces were fit by the three-exponential equation, and kobs for phase 1 was plotted as a function of unlabeled competitor ZPI concentration. The solid line is a linear least squares fit of the wild-type intact ZPI data.