FIGURE 5.

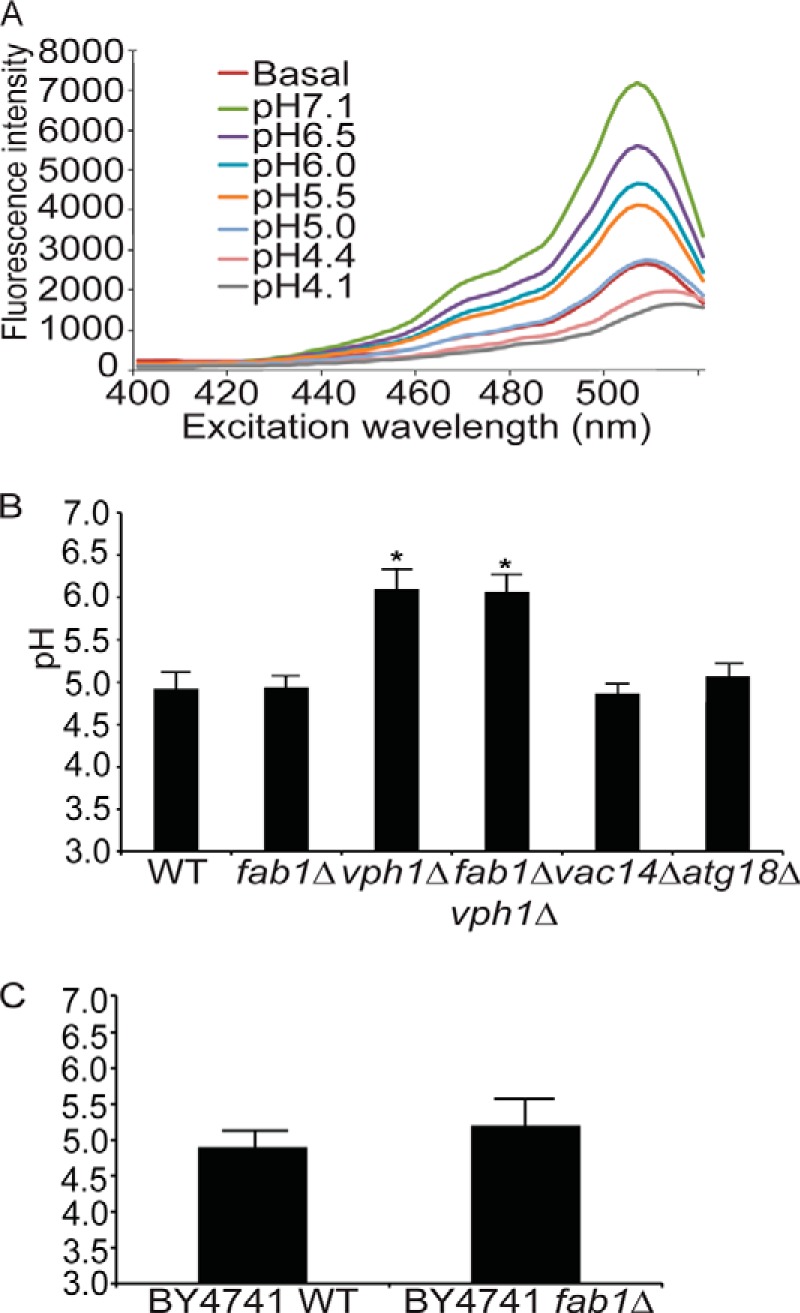
Quantification of vacuolar pH using cDCFDA-based fluorimetry. A, representative fluorimetry scan using wild-type yeast cells loaded with cDCFDA. A fluorescence intensity scan was obtained for resting yeast cells (Basal) followed by fluorescence intensity scans of cells from the same labeled population but in which vacuolar pH was equilibrated to the indicated pH by incubating them with CCCP for 4 min. B, peak intensities from calibration scans as shown in A were then used to generate calibration curves using a sigmoidal fit for the indicated strains to identify the basal pH. Using this method, we calculated the mean vacuolar pH and S.E. for wild type (n = 10, where each n is one independent experiment), fab1Δ (n = 10), vph1Δ (n = 3), fab1Δ vph1Δ double mutant (n = 3), vac14Δ (n = 3), and atg18Δ (n = 3). Using ANOVA and Tukey's post hoc test, there was a significant difference (*) for vph1Δ and vph1Δ fab1Δ against wild-type, fab1Δ, vac14Δ, and atg18Δ (p < 0.01) cells but not between wild-type, fab1Δ, vac14Δ, and atg18Δ cells. C, the vacuolar pH for wild type (n = 4) and fab1Δ (n = 3) in the BY4741 background strain. There was no significant difference between these strains and those from the SEY6210 background strain using Student's t test.
