FIGURE 5.
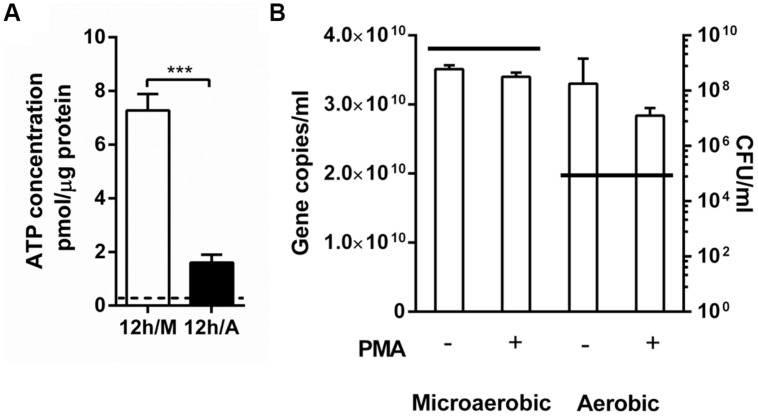
Comparison of intracellular ATP levels and viability in C. jejuni between aerobic and microaerobic conditions. (A) The concentrations of intracellular ATP in C. jejuni after 12 h culture under microaerobic conditions (12 h/M) and aerobic conditions (12 h/A). The initial ATP level at 0 h is indicated with a dotted line. A Student’s t-test was carried out for statistical analysis. ∗∗∗P < 0.001. (B) Quantitative PCR (qPCR) was performed with or without PMA treatment after 12 h growth under different oxygen conditions. A horizontal line indicates the average CFU levels of the samples that were used for qPCR.

