
Figure 7. Delayed Plasticity by PV-Cell-Specific Clock or Bmal1 Deletion.
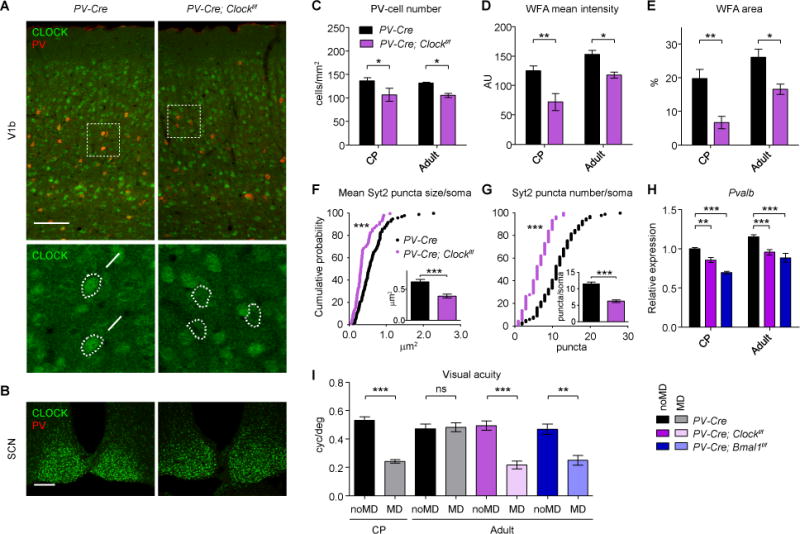
(A) Conditional Clock deletion in V1b at P27 of V-Cre; Clockf/f mice. Arrows, CLOCK-expressing PV-cells. Arrowheads, CLOCK-depleted PV-cells. Scale bar, 100 μm.
(B) CLOCK expression in the SCN at P66. Scale bar, 100 μm.
(C–E) PV-cells and WFA-stained perineuronal nets in V1b at CP (P27) and adult ages (P60–P80). Decreased number of PV-cells (C), WFA mean intensity (D), and WFA area (E) quantified at CP (PV-Cre, 4 mice; PV-Cre; Clockf/f, 3 mice) or adult ages (PV-Cre, 3 mice; PV-Cre; Clockf/f, 6 mice). AU, arbitrary units. *P < 0.05; **P < 0.01 (two-way ANOVA, Bonferroni’s post-hoc analysis). Values are mean ± s.e.m.
(F and G) Immature Syt2 puncta onto pyramidal neurons in layer 4 of V1b in PV-Cre (98 cells from 4 mice) and PV-Cre; Clockf/f mice (64 cells from 3 mice) at CP (P27). Cumulative plots for mean Syt2 puncta size per soma (F) and Syt2 puncta number per soma (G), and their mean values (insets). ***P < 0.001 (K–S test for cumulative plots; Mann-Whitney test for insets).
(H) Pvalb expression in V1 of Clock or Bmal1 conditional knock-out mice at CP (P26–P28, 3–8 mice) or adult ages (P60–P90, 3–9 mice). **P < 0.01; ***P < 0.001 (two-way ANOVA, Bonferroni’s post-hoc analysis). Values are mean ± s.e.m.
(I) Reduced visual acuity after 4 days of monocular deprivation (MD) in PV-Cre controls during the CP (noMD and MD, 6 mice each) but not in adulthood (noMD and MD, 5 mice each). In contrast, a delayed CP plasticity is seen in adult PV-Cre; Clockf/f and PV-Cre; Bmal1f/f mice (noMD and MD, 5 mice each). **P < 0.01; ***P < 0.001; ns, not significant (t-test). Values are mean ± s.e.m. See also Figures S6, S7, and S8.