
Figure 8.
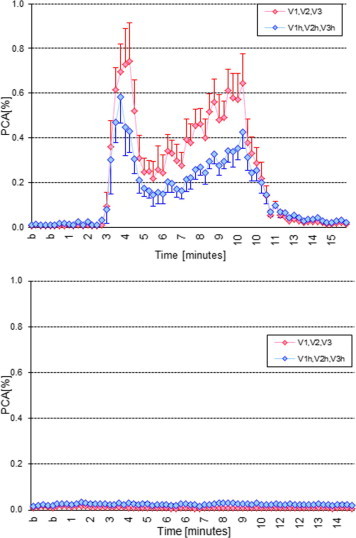
Principal component analysis (PCA) of the ST-T wave (from the J point to the end of the T wave) in the right precordial leads of ECGs recorded during diagnostic ajmaline test. (A) Positive ajmaline test in a 15-year-old girl with the BrS and a past history of syncope of presumable arrhythmic origin. (B) Negative ajmaline test in a 67-year-old asymptomatic man with a family history of BrS and sudden cardiac death. Each bar represents the PCA value (ratio of the 2nd/1st eigenvalue) from analysis of one 10-s ECG recording. Two to five 10-s ECGs were recorded during the test. On the X-axis, time is shown in minutes from the beginning of the test. ECGs were recorded at baseline (b) as well as up to 15 min after the start of the drug administration. PCA has been applied to the V1–V3 leads (blue diamonds) and to leads V1–V3 recorded from the 3rd i.c. space (red diamonds). Data are presented as mean ± standard deviation (SD) of all complexes within one 10-s ECG. Generally, higher values reflect more heterogeneous (and, hence, more abnormal and potentially more arrhythmogenic) ventricular repolarisation. The figures show that the appearance of diagnostic type 1 Brugada ECG pattern during the positive test (A) is accompanied by a striking increase in the PCA ratio, whereas during a negative test, there is practically no change in PCA (the SD deviation bars are hidden within the diamond bars). Adapted from [100].