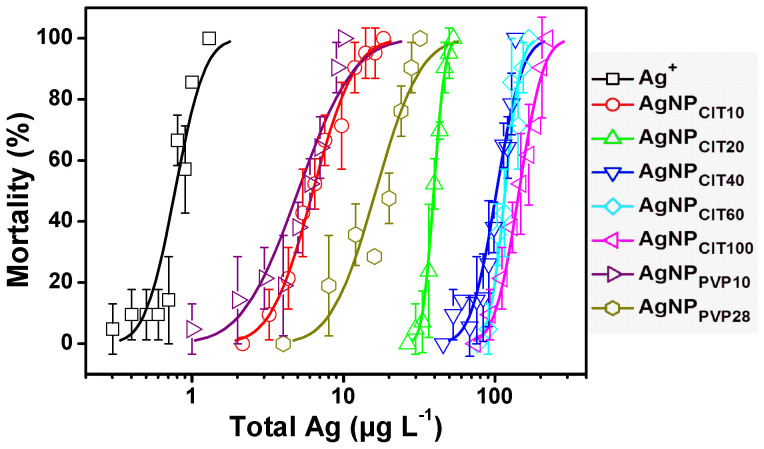
Figure 3. Dose-response curves of mortality of Daphnia magna against exposure concentration as nominal total Ag of AgNO3 and AgNPs.
The AgNO3 and AgNPs suspensions (five sodium-citrate coated AgNPs (AgNPCIT) and two polyvinylpyrrolidones (PVP) coated AgNPs (AgNPPVP)) were all prepared in 0.1 mmol L−1 NaNO3 (pH 7.8 ± 0.2 adjusted by NaOH) medium. Error bars represent the standard deviation from triplicates. The lethal concentration probability lines were plotted on the basis of probit regression results obtained from SPSS 16.0 software.

