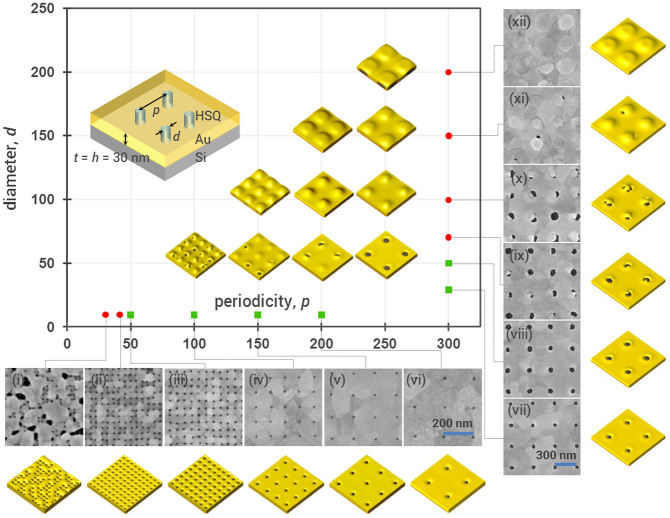
Figure 5. Parameter variations with simulations and experiments for t = h = 30 nm.
Experimental results were obtained for (i–vi) d ~ 10 nm, p = 30 nm, 40 nm, 50 nm, 100 nm, 150 nm, and 200 nm respectively; (vii–xii) p = 300 nm, d = 30 nm, 50 nm, 70 nm, 100 nm, 150 nm, and 200 nm respectively. Simulation results were obtained for the entire parameter space, and displayed here over an area of 400 nm by 400 nm. Green squares indicate experimental parameters with which nanoaperture arrays were achieved. Red dots indicate parameters with which dewetting fails to produce aperture arrays. Corresponding results for t = h = 60 nm are shown in supplementary figure S4.

