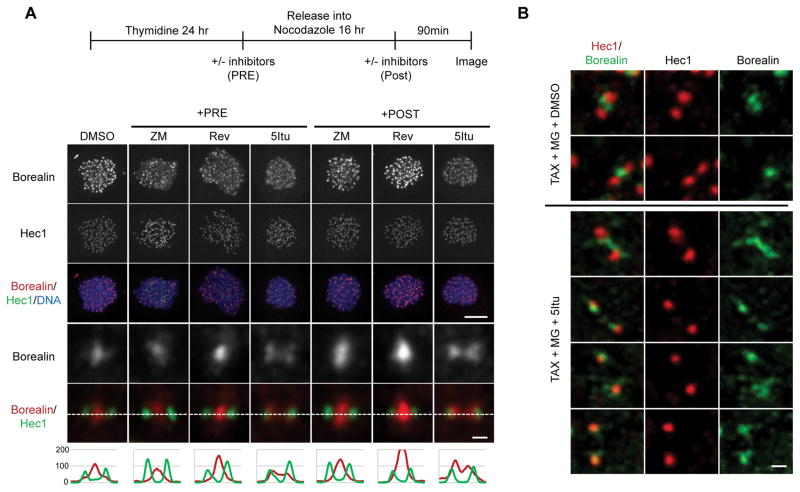
Figure 4. Kinetochore-proximal Borealin pool observed after Haspin inhibition.
A.) Borealin localization compared to Hec1. Cells were prepared as shown in the schematic. Maximum projection images of nocodazole-arrested HeLa M cells treated with the indicated inhibitors either before (+PRE) or after (+POST) mitotic entry are shown. Immunofluorescence was performed using antibodies against endogenous Borealin and Hec1. Examples of whole cell maximum projections (scale bar = 10μm) are shown. Close-up images and line scans of individual sister kinetochores/centromeres from a single plane are at the bottom (scale bar = 0.5μm). B.) Co-localization of Borealin and Hec1 in taxol arrested cells exposed to 5Itu. HeLa M cells were exposed to taxol for 6 hours, and the with MG132 with or without 5Itu. Immunofluorescence carried out 90 minutes post-5Itu addition. Confocal images were obtained with a 0.1μm z-step followed by deconvolution using AutoQuant X3 software. Projection images are shown (scale bar = 0.5μm).

