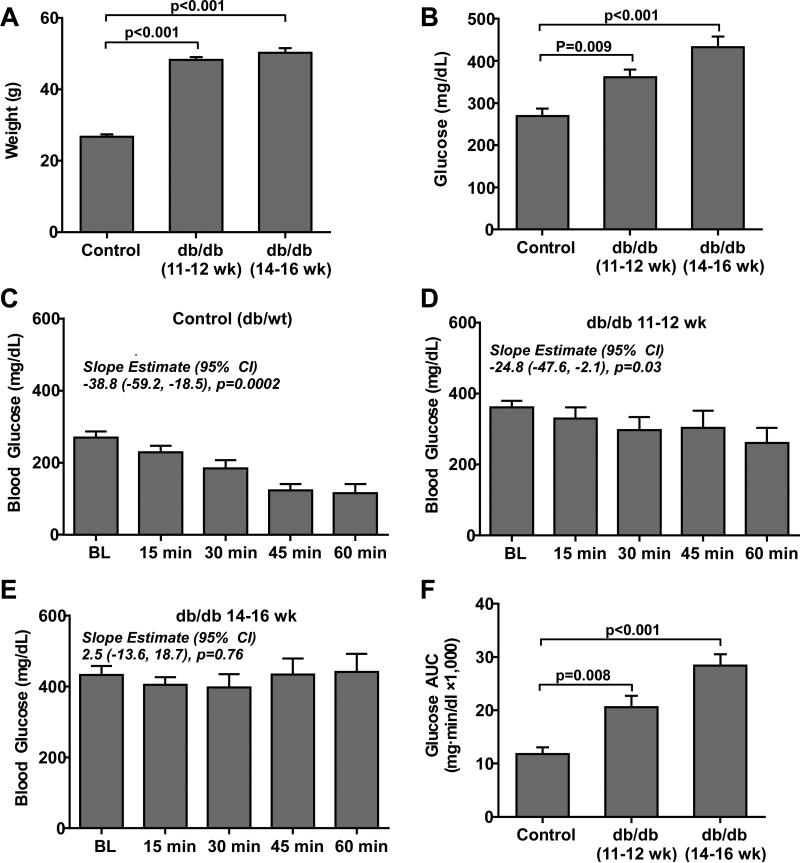
Figure 1.
(A) Mean (±SEM) body weight and (B) fasting blood glucose for control (db/+) mice at 16 weeks of age (n=5), and db/db mice at 11-12 (n=5) or 14-16 (n=8) weeks of age. Slope estimates from the GEE model, which represent change in glucose in 15 min intervals from baseline, indicate significant reductions in glucose response to insulin in control and to a lesser extent in db/db mice at 11-12 weeks of age. (C to E) Mean (±SEM) blood glucose concentration for the different animal groups after administration of insulin (1 u/Kg, I.P.) (F) Mean (±SEM) glucose AUC measured during insulin challenge in the different animal groups.

