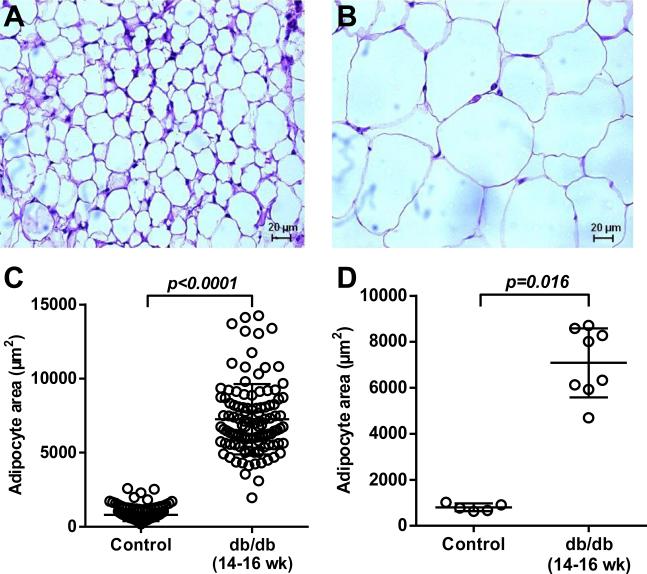
Figure 2.
Representative histology images with H&E staining illustrating differences in adipocyte size between (A) control and (B) 14-16 week-old db/db mice (scale at bottom). (C) Histology data on adipocyte area measured for all cells with superimposed mean (±SD). (D) Histology data on adipocyte area displaying data as average for each animal with superimposed mean (±SD).

