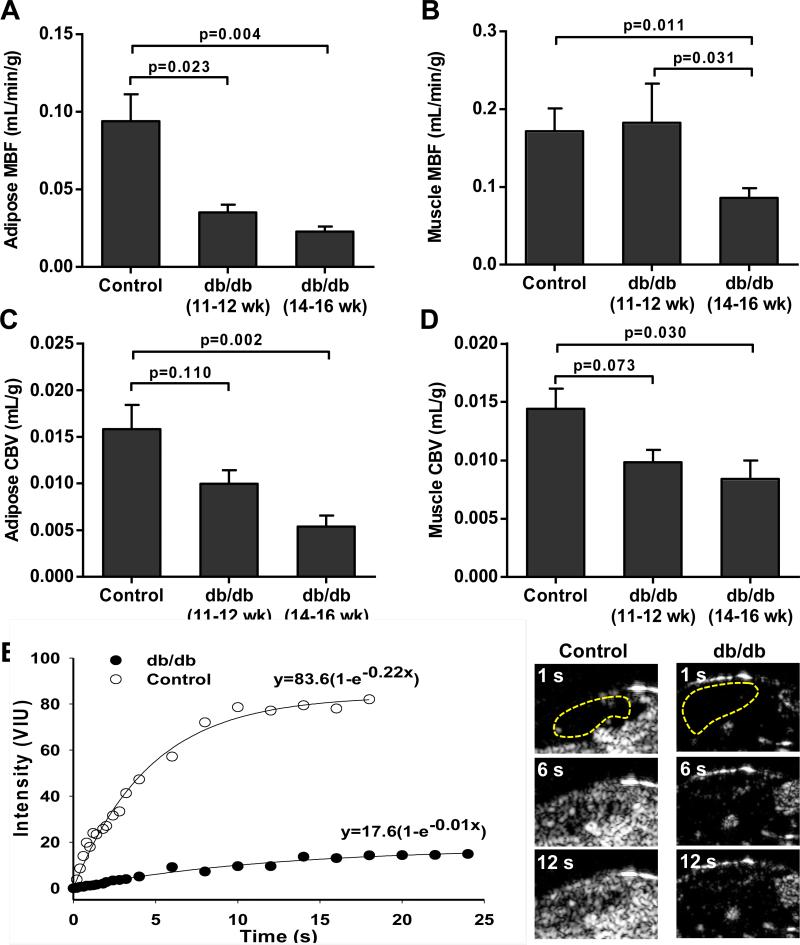
Figure 3.
Mean (±SEM) MBF in (A) adipose tissue and (B) in skeletal muscle in the different animal groups derived from CEU time-intensity data. Mean (±SEM) CBV in (C) adipose tissue and (D) in skeletal muscle in the different animal groups derived from CEU time-intensity data. Data were generated from control (db/+) mice 16 weeks of age (n=5), and db/db mice at 11-12 (n=5) or 14-16 (n=8) weeks of age. (E) Representative examples of adipose CEU data and images at immediately after a destructive pulse sequence and at 6 and 12 seconds from a control and 16 week-old db/db mouse. The adipose regions-of-interest are defined by the yellow dashed lines. *p<0.05 versus control; †p<0.05 versus db/db 11-12 week-old.

