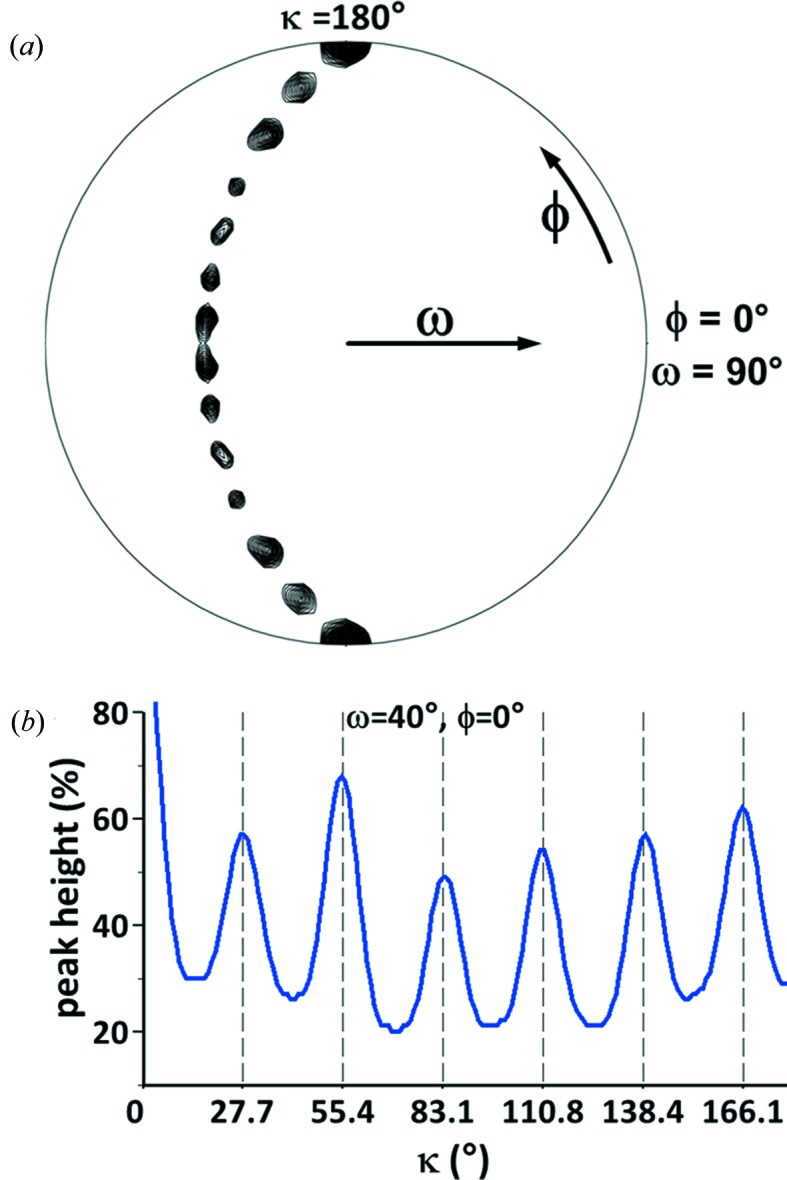
Figure 3.

Self-rotation function analysis of the diffraction data. (a) The stereographic projection of the κ = 180° section of the self-rotation function calculated at 1.82 Å resolution in space group C2 was plotted at a contour level of 40% of the origin peak. The crystallographic twofold axis is at ω = 90°, ϕ = 90°. Six additional twofold axes are visible which form a crescent. (b) Signal of a recurrent peak at ω = 40°, ϕ = 0° as a function of κ that is not visible in (a). The peaks follow the term (n × 360°)/13 with the integer n ≤ 6, indicating 13-fold NCS. Combination of this axis with the crystallographic twofold axis leads to the twofold NCS axes visible in (a).
