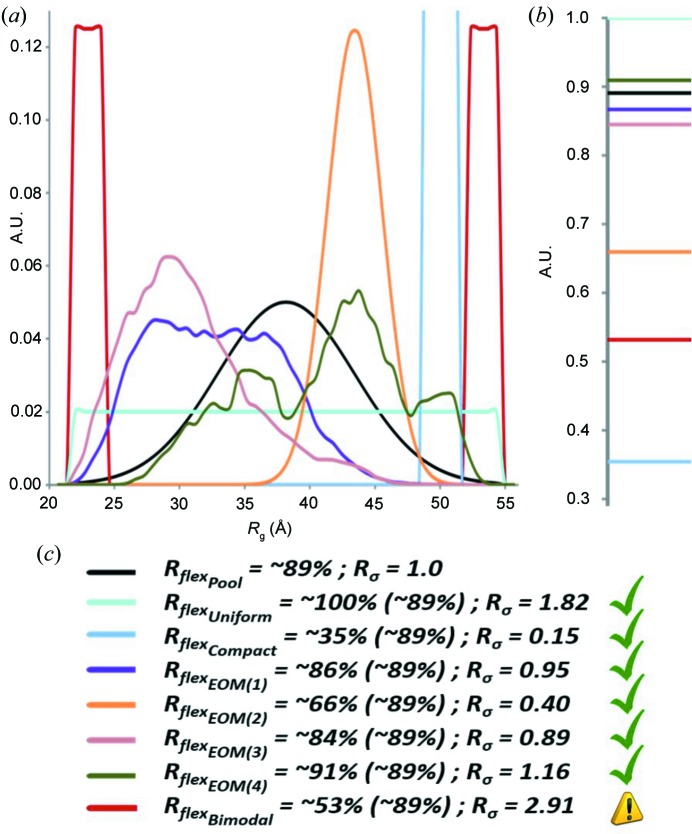
Figure 3.
Qualitative characterization of particle flexibility from various characteristic R g distributions. (a) Pool (black), which represents the case of complete randomness; EOM(1) (purple), EOM(2) (orange), EOM(3) (pink) and EOM(4) (dark green) which represent the real outcome of independent EOM 2.0 runs in terms of R g distributions; uniform (cyan), compact (light blue), bimodal (red) which represent extreme (theoretical) cases. (b) H b(S) values computed from the distributions in (a). (c) Combination of R flex values for all the distributions (and compared to the threshold of randomness computed from the pool, in brackets, ∼89%) with the associated R σ values. The last example (red curve) indicates a potentially inconsistent result.

