
Figure 1.
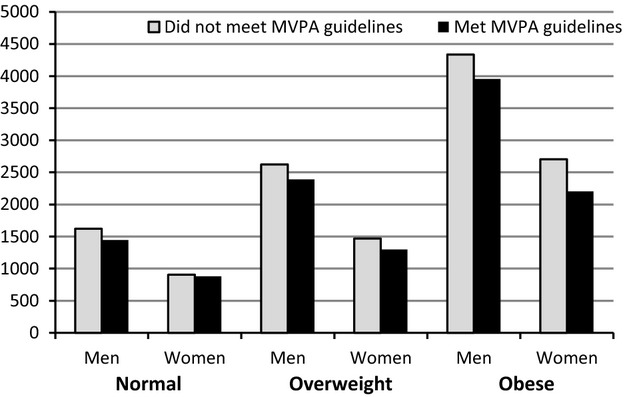
Mean* VAT volume in cm3 among men and women by BMI category. *Means are adjusted for age, education, cohort, race, and actical wear time (provided from sex‐specific regression models stratified by BMI category). BMI indicates body mass index; MVPA, moderate‐to‐vigorous physical activity; VAT, visceral adipose tissue.