
Figure 1.
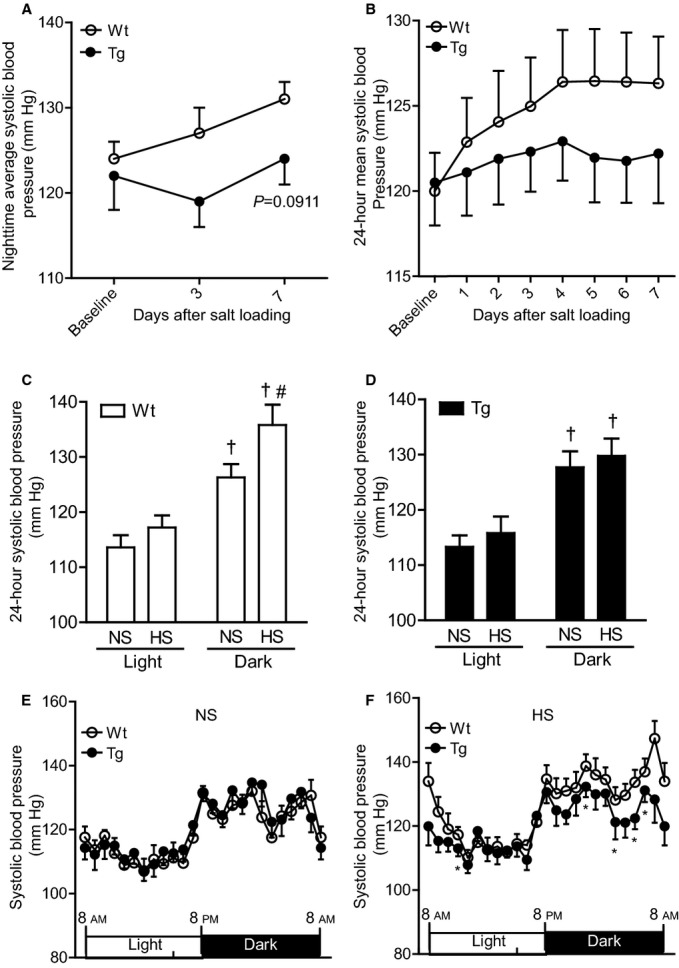
Effects of dietary HS loading on BP in Wt and Tg mice. A, Effects of dietary HS loading on nighttime average systolic BP using the tail‐cuff method. Values are expressed as mean±SE (n=8 in each group). B, Daily and 24‐hour mean systolic BP on telemetry during 7 days of dietary HS (4% NaCl) loading. Values are expressed as mean±SE (n=6 in each group). C and D, Effects of dietary HS loading on systolic BP on telemetry during the light and dark cycles in Wt mice (C) and Tg mice (D). NS designates mice at baseline fed an NS diet (0.3% NaCl); HS designates mice fed an HS diet (4% NaCl) for 7 days. Values are expressed as mean±SE (n=6 in each group). †P<0.01, light vs dark. #P<0.05, NS vs HS. E and F, Circadian systolic BP profile of the Wt and Tg mice on an NS diet (E) and on the seventh day after the start of HS loading (F). Values are expressed as mean±SE (n=6 in each group). *P<0.05, Tg vs Wt mice. BP indicates blood pressure; HS, high salt; NS, normal salt; rATRAP‐Tg, renal angiotensin II type 1 receptor associated protein transgenic; Tg, transgenic; Wt, wild type.