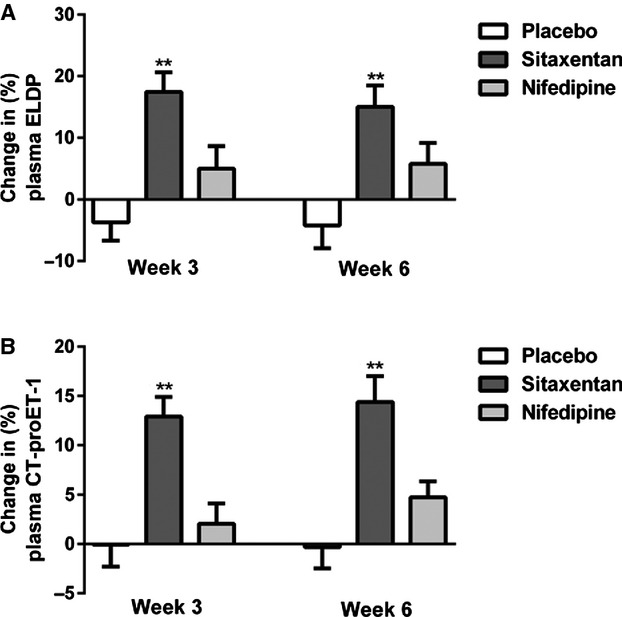
Figure 5.

Percentage change from baseline in plasma ELDP (A) and plasma CT‐proET‐1 (B) following 3 and 6 weeks of treatment with placebo (open bar), sitaxentan (dark grey bar), and nifedipine (light grey bar) (mean±SEM, *P<0.0001 for sitaxentan at 3 or 6 weeks vs baseline). CT‐proET‐1 indicates C‐terminal pro‐endothelin‐1; ELDP, endothelin‐like domain peptide.
