
Figure 4.
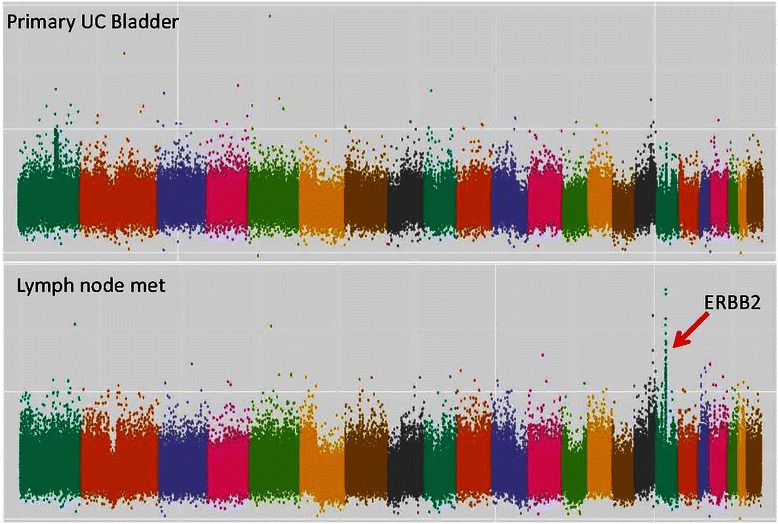
DNA copy number data from patient #63. Copy number plot with the x-axis denoting each point across the genome - each chromosome is highlighted in a different colour starting with chromosome 1 on the left side. Y-axis enumerates the log-2 copy number value at each point across the genome. Red arrow indicates gene amplification highlighted in this manuscript. Normal ERRB2 copy number in primary tumour (log2 copy number ratio 0.34) and amplification of E2F3 in the metastasis (log2 copy number ratio 1.19).