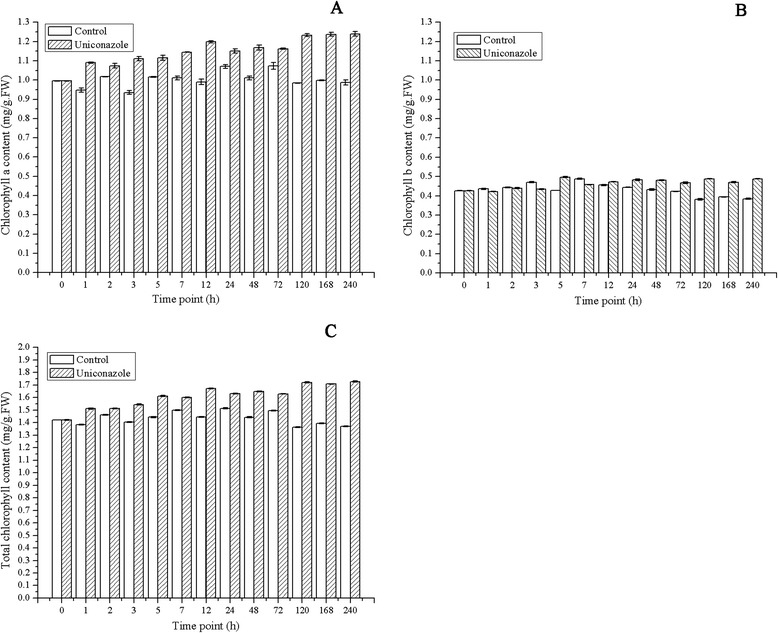
Figure 3.

Chlorophyll a and chlorophyll b content of L. punctata. (A) Chlorophyll a content. (B) Chlorophyll b content. (C) Total chlorophyll content. Values are given as the mean ± SD of three experiments for each group.

Chlorophyll a and chlorophyll b content of L. punctata. (A) Chlorophyll a content. (B) Chlorophyll b content. (C) Total chlorophyll content. Values are given as the mean ± SD of three experiments for each group.